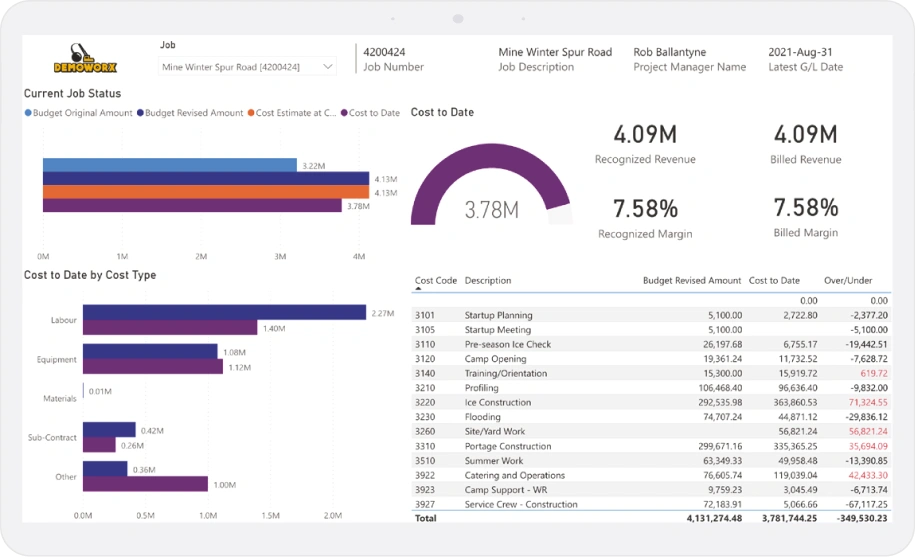
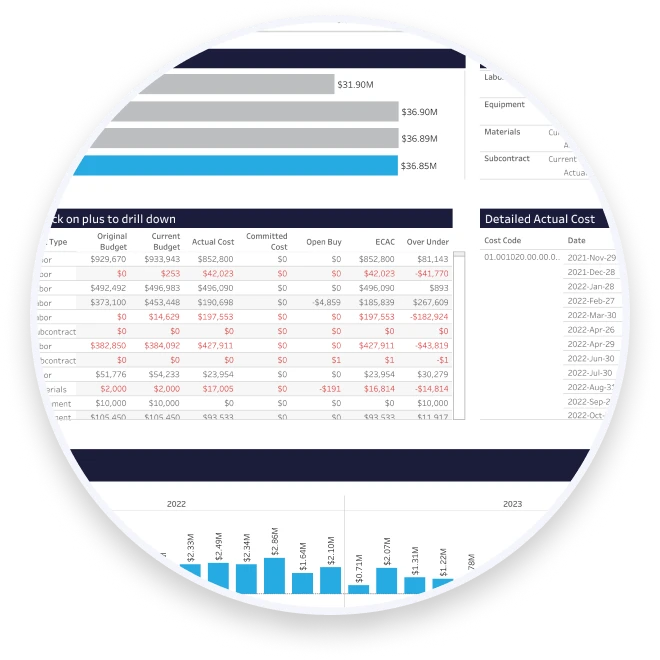
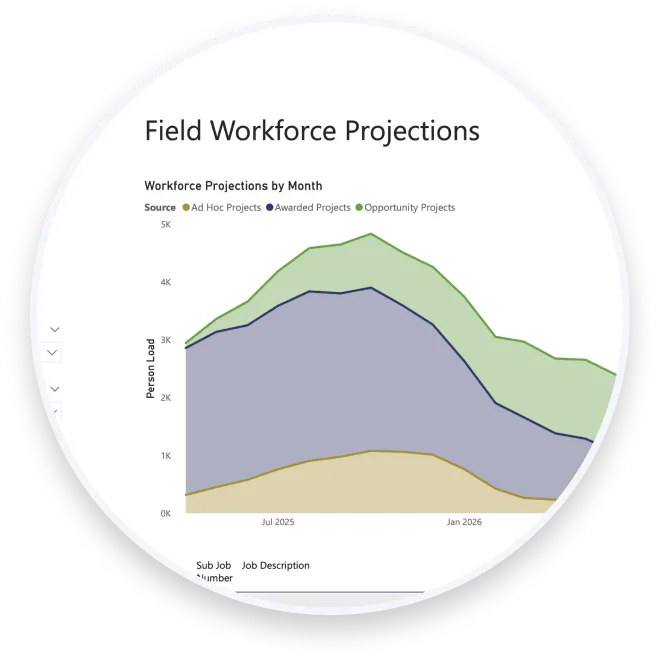
Business Intelligence Consulting Services
As your analytics partner, you can lean on Onware’s 20+ years of experience implementing Tableau and Microsoft Power BI for leading construction firms.

We work with popular Construction ERP systems including: Computer Guidance Corporation's eCMS, JD Edwards EnterpriseOne, Sage 200 & 300, Viewpoint Spectrum, Viewpoint Vista, Epicor, Deltek, AccuTerm, NetSuite, SAP, CMiC, Procore, Salesforce and Oracle.


Over 270 forward-thinking companies trust Onware to connect their data, automate processes, design dashboards and create immersive visualizations. Contact us and see how custom software and BI solutions for team management and executive oversight can help you.
Construction BI Solutions, Tailored for You
As your trusted BI and data analytics partner, Onware integrates your systems and creates automated practical reports and dashboard visualizations, helping you track key metrics and KPIs that matter with a clear, modern analytics strategy moving forward.

Excel Reports
Weighing You Down?

Organizations face several critical challenges in leveraging their data effectively
- Time and effort wasted combining data and creating reports by hand
- Lack of knowledge creating practical reports
- Difficulty managing and analyzing large volumes of data
- Difficulty tracking key metrics and KPIs
- Lack of seamless system integration
- Missed opportunities and inefficiencies hindering decision-making
There’s another way. It’s time to upgrade to a modern BI solution.
Onware has helped
over 51 companies


Onware combines deep construction industry knowledge with advanced BI and analytics skills to equip organizations with the insights needed for optimal decisions.

Background
A national electrical contractor relied on an outdated Excel/SQL tool to forecast field workforce needs, resulting in slow refresh times, poor data integration, and misaligned insights between teams due to inconsistent report updates.
Solution

Background
Clark Builders, a leading construction management company, needed better data visualization and reporting to enhance project performance and decision-making.
Solution

Background
DIALOG, a design firm, faced inefficiencies in tracking construction project data using traditional methods.
Solution
Custom Reporting Solutions
Discover some of the powerful dashboards and reports we’ve built.

Job Cost Reports
Dive Deep from High-Level Budgets to Detailed Transactions
Analyze your job costs like never before with the ability to drill down—from overall budgets to specific transactions, ensuring complete financial transparency.

Labor Reports
Real-Time Insights on Hours, Overtime, and Equipment Utilization
Stay on top of workforce management with up-to-the-minute data on job hours, overtime costs, and even equipment usage, helping you maximize efficiency.

Accounting and Financial Statements
Comprehensive Insights from Branches to Board-Level Overviews
Access professional financial statements tailored for board-level review, while drilling down into branch performance, location-based data, and progress against budgets and goals.

Supply Chain Reports
Detailed Analytics on Inventory Trends, Purchasing, and Obsolescence
Understand your supply chain like never before with insights on inventory patterns, purchasing efficiencies, and the identification of excess or obsolete stock.
FAQ

What does a BI platform do?
Business Intelligence platforms are software tools that allow you to see and understand your data. This includes gathering data from multiple source systems and refreshing data on regular schedules or even using a real-time connection. They give tools to work with the data and create dashboards, charts, and tables. You can go further by creating filters, calculated fields and using input parameters to create interactive analyses. Finally, the BI platform will allow the results to be shared and collaborated on using the web, mobile apps, or embedded in your existing applications.
How long does it take implement BI solutions?
Onware offers a Guided Evaluation that aims to aid organizations that are interested in using BI tools such as Tableau and Power BI. Typically, through a one-week on-site engagement, we are able to connect to your data and deliver up to four prototype data visualizations. The Guided Evaluation is a great tool to jump start the journey to becoming a data-driven organization.
Do I need to have all my data in a data warehouse?
Data warehouses, data lakes, data marts – these are all terms that we are hearing in connection with BI and Analytics. To be clear, it is not necessary to set up and configure these tools before starting with BI and Analytics. Often, it is better to start with a BI tool to start exploring and seeing your data to help inform and analyse what the overall data architecture for your organization will look like.
Tableau vs Power BI vs Excel – which is the best solution?
Whether you choose Tableau or Power BI, both tools have significant advantages over Excel. Data analytics tools are all about seeing and understanding your data in a visual way. To help you answer your important business questions at a glance, rather than wading through a sea of numbers. In addition analytics tools are built with things like data quality and refreshes in mind, so you are always looking at the most recent data about your business. Onware doesn’t typically recommend Tableau or Power BI without first having a discussion about your business and your data requirements, to help inform and pick the best solution.
Do you work with other industries outside of construction?
Onware has experience working with a variety of industries, including agriculture, manufacturing and distribution, and automotive. Our extensive knowledge of business financial and supply chain data helps us to get started faster when working with new clients. We focus on the architecture, engineering, and construction industry because it’s what we know best and have the most experience with.