
QuickBooks Desktop remains the backbone of financial management for many construction companies. It’s reliable, familiar, and deeply embedded in day-to-day operations. But when it comes to reporting, QuickBookscan feel like a closed box. Accessing data often requires installing complicated desktop software on every machine, creating barriers for teams who simply need timely- insights.
The Challenge
- Limited accessibility: QuickBooks Desktop data is locked behind local installations.
- Cumbersome workflows: Each user must jump through hoops to connect, slowing down decision -making.
- Static reporting: Traditional reports lack interactivity and don’t scale well across teams.
The Solution: Bringing BI Tools on the Web
Connecting QuickBooks Desktop data to modern BI platforms like Tableau or Power BI gives teams web-based access to the information they rely on. Instead of wrestling with installs or outdated spreadsheets, employees can login and interact with dashboards—anytime, anywhere.
- Secure, role-based access
- Interactive dashboards for AR/AP, job cost transactions, payroll and timesheets
- Always up to date: Unlike static exports, BI tools refresh data automatically on a schedule (e.g., daily), ensuring users always work with the latest information without extra manual steps
- Scalable reporting across the organization without duplicating effort
How It Works
A locally installed connector pulls data from your QuickBooks company file and sends it to your selected BI tool or database. Once in the database, the data will be updated automatically and will be ready for reporting.
- Extract the Data: reads customers, vendors, chart of accounts, invoice transactions, bill transactions, etc.
- Clean and Store It: once the data is moved to the cloud or SQL database, it’s possible to work with it easily, standardizing on table and column names for consistent reporting.
- Auto-refresh: Scheduled updates keep everything current, there is no need for manual exports or access to QuickBooks to get the data.
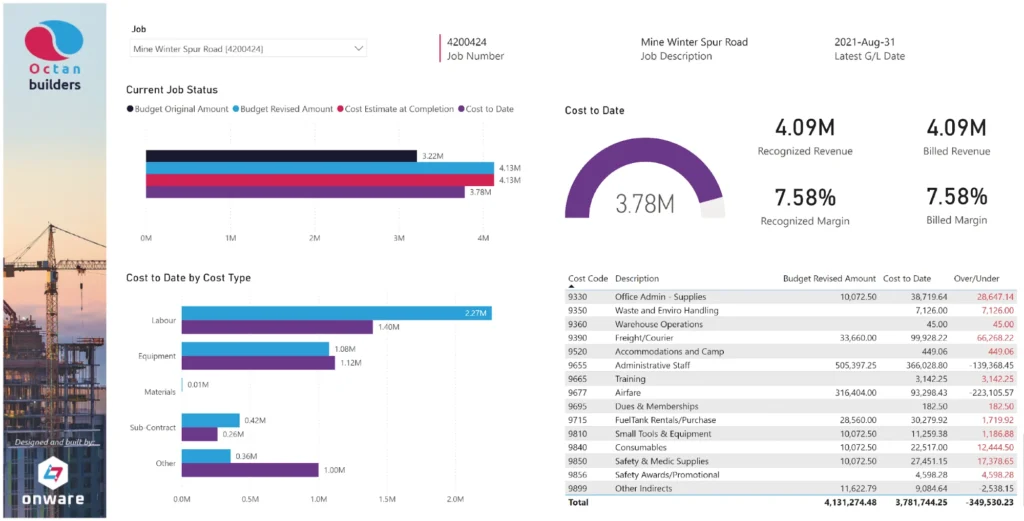
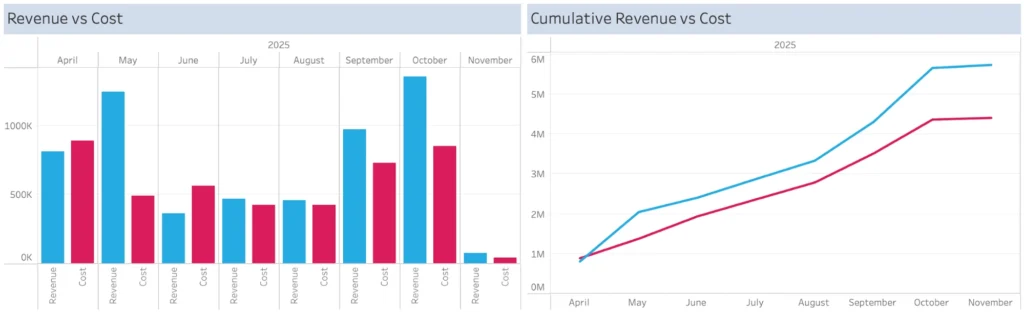
- Build Dashboards: job cost, accounts payable (AP), accounts receivable (AR), payroll, consolidated financials; web based and easily available for the CFO, Executive, and project teams.
- Control Access: permissions can determine who sees which jobs or data.
How Onware Makes It Work
We’ve developed a proven, construction-ready approach to bridge QuickBooks Desktop data with BI tools:
- ODBC Connectivity: Establishing a live connection between QuickBooks and external reporting tools. We’ve had particular success with the CData ODBC Driver for QuickBooks, an easier to configure and more reliable solution than other options we tested.
- Bridge Software: Securely exposes the ODBC connection to Tableau or Power BI, allowing data to flow from the local QuickBooks environment into dashboards without requiring every user to install QuickBooks Desktop.
- Curated Data Sources: receivables, payables, job cost transactions, and timesheets/payroll — all reusable and ready to feed dashboards.
Enhancing the Data for Construction Reporting
Raw QuickBooks data isn’t structured around how project managers think. Onware reshapes the data so it aligns with construction workflows:
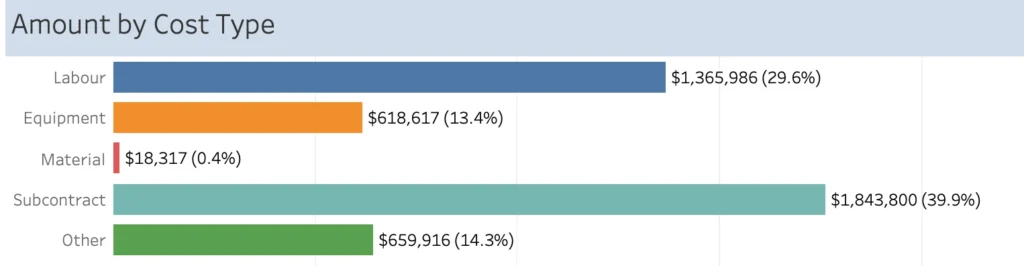
- Chart of Accounts Mapping: Transforming raw accounts into standard construction cost categories — Labor, Equipment, Materials, Subcontract, and Other.
- Consistency Across Systems: Aligning QuickBooks data with formats used in construction-focused financial systems.
- Project Manager Friendly: Presenting information in meaningful ways PMs can immediately act on, rather than by accounting codes.
Drill-Down Insights for Project Teams
Tableau and Power BI dashboards allow users to move seamlessly between summaries and detail:
- Review an issue at a high level, then drill directly into the invoices, payroll entries, or timesheet records behind it, all without switching screens
- Preserve context while exploring details
- Quickly identify cost drivers – invoices, payroll entries, or timesheet records contributing to a cost overrun – all within a single interactive view.
Consolidating Construction Data Across Multiple Companies
Construction companies often manage multiple related entities—subsidiaries, joint ventures, or related companies. Onware’s approach builds a data warehouse utilizing tools such as Azure Data Factory to consolidate QuickBooks data across entities:
- Unified reporting
- Cross-company comparisons and roll ups
- Scalable architecture as teams grow
Tracking Jobs with QuickBooks Classes
QuickBooks Desktop lacks a native job tracking module designed for construction so many construction firms use the Class functionality, assigning each job to a different class. Onware has deep experience working with this setup:
- Class-based job tracking: Each job represented as a class, grouping costs and revenues by project.
- BI integration: Pulling class data into Tableau or Power BI for job-level reporting.
- Accelerated delivery: Our experience means we can hit the ground running and deliver working dashboards faster.
Extending Security to Job-Level Access
BI tools allow Onware to mirror and enhance QuickBooks permissions:
- Granular permissions: Project managers or other users can be restricted to only the jobs they are responsible for.
- No “all or nothing” access: Dashboards can be filtered so each user sees only the relevant slice of data.
- Confidence in governance: Leaders can share insights broadly without compromising sensitive information.
Why It Matters
Construction projects thrive on clarity. When financial and operational data is accessible, structured in a way that resonates with project managers, enhanced with drill-down interactivity, consolidated across multiple entities, refreshed automatically, and secured at the job level, leaders can make faster, smarter decisions.
By connecting QuickBooks Desktop to modern BI tools and shaping the data to mirror construction workflows, Onware helps teams move beyond the limitations of static desktop reporting into a world of secure, web-based analytics for faster, smarter project delivery.