
Why do some KPI dashboards become indispensable to leadership while others are ignored after launch?
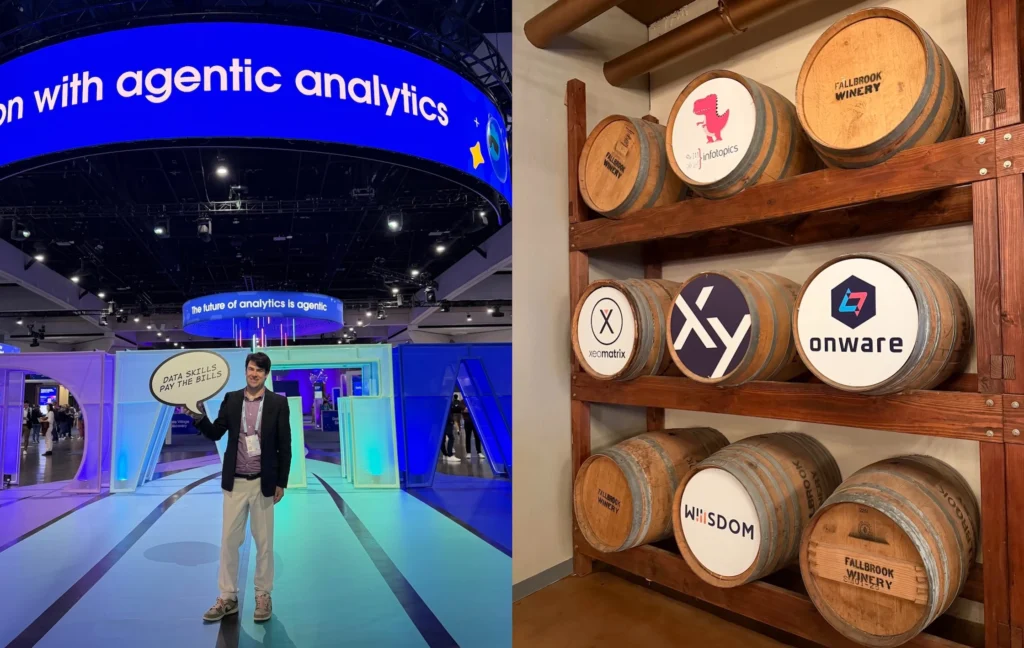
At Tableau Conference 2026, hundreds of data and operations leaders packed Tableau Ambassador Fraser Gallop’s session, “Build KPI Dashboards Leaders Actually Use.” Demand was so high that the presentation was delivered twice, with both sessions drawing standing-room-only crowds.
The interest reflects a challenge facing construction and industrial organizations everywhere. Leaders are investing in business intelligence, yet many still struggle with dashboards that are difficult to trust, slow to update, or fail to support better decision-making.
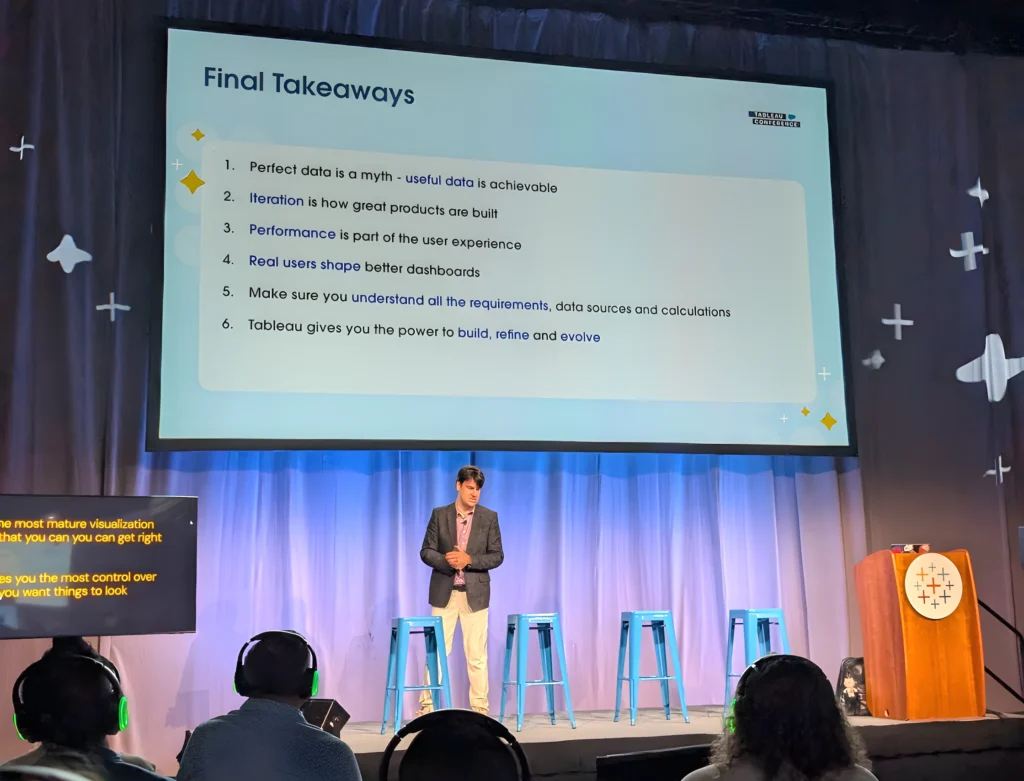
Drawing on years of experience helping contractors transform ERP and operational data into actionable insights, Fraser shared the principles behind construction KPI dashboards that executives actually use. The session covered practical strategies for improving dashboard design, aligning metrics with business goals, avoiding common implementation pitfalls, and delivering reporting projects that create lasting value.
Whether you’re using Tableau, Microsoft Power BI, or another analytics platform, these lessons apply to any organization looking to build dashboards that improve forecasting, financial reporting, and operational performance.
Five KPI Dashboard Lessons for Construction Leaders
This presentation was built on years of Onware’s hands-on experience delivering KPI dashboard projects for construction, engineering, and industrial organizations. That real-world foundation shaped a session focused on practical, actionable guidance:
1. Best Practices for High-Impact KPI Dashboards
Design principles that consistently lead to dashboards executives actually return to — clarity, hierarchy, intentional layout, and decision-driven design.
2. Common Pitfalls to Avoid
The traps that derail KPI initiatives, including misaligned metrics, cluttered layouts, and dashboards that try to serve too many audiences at once.
3. How to Deliver a Successful KPI Dashboard Project
The project patterns that work: stakeholder alignment, metric definitions, iterative design, and communication rhythms that keep leadership engaged.
4. Real Examples from Onware’s Client Work
Before-and-after transformations showing how messy project data can become clean, actionable KPIs that drive real business outcomes.
These insights weren’t theoretical — they were shaped by Onware’s extensive experience delivering KPI dashboards for organizations with complex data, evolving requirements, and high expectations from leadership teams. This is the difference between a dashboard that gets used once… and one that becomes the starting point for every leadership meeting.
One example is our work with Miller Brothers Construction, where a modern forecasting solution reduced forecasting time by 90%. View the case study.
“The best dashboards don’t answer every question. They help leaders make better decisions faster.”
— Fraser Gallop, CEO of Onware & Tableau Ambassador
How Onware Builds KPI Dashboards That Get Used
Successful dashboards don’t begin with charts. They begin with understanding the decisions leaders need to make.
Onware works with construction and industrial organizations to connect ERP systems, financial data, project controls, and operational reporting into dashboards executives trust. With deep expertise in construction ERP platforms and business intelligence, our team combines Tableau, Microsoft Power BI,data warehouse design, and custom software development to deliver reporting systems that improve forecasting, project visibility, and decision-making
Our approach focuses on delivering dashboards that become part of the leadership process, not just another report that gets opened once and forgotten.
Supporting the Community: Onware Sponsors the Data + Women Pre-Game Event

Onware was also proud to sponsor the Data + Women Pre-Game Event at Tableau Conference — a gathering dedicated to elevating and empowering women across the analytics community.
Supporting women in data is essential to building a stronger, more inclusive industry. Diverse teams ask better questions, design better dashboards, and create solutions that reflect the real world.
We’re honoured to help champion that mission.
Extending the Conversation: Presented Again at the Team DataFam Tableau User Group
Following Tableau Conference, Fraser was invited to present the session again for the Team DataFam Tableau User Group.
The presentation expands on the principles summarized in this article and includes real-world dashboard examples from construction organizations. Watch the full recording below:
Why Construction Companies Struggle with KPI Dashboards
Construction companies generate enormous amounts of operational and financial data every day. Yet many leadership teams still rely on manual reports, disconnected spreadsheets, and outdated dashboards that don’t provide a complete picture of project performance.
Successful KPI dashboards solve these problems by bringing trusted data together in one place, giving executives confidence to make faster, better-informed decisions.
Most construction and industrial teams face the same challenges:
- Too much manual reporting: PMs and analysts spend hours exporting, merging, and reconciling spreadsheets.
- Multiple disconnected systems: ERP, job cost, timekeeping, equipment, and forecasting tools rarely align.
- Forecasting challenges: Leaders don’t trust projections because the underlying data is inconsistent.
- Leadership lacking confidence in the numbers: Executives hesitate to make decisions because dashboards don’t reflect reality.
- ERP and data integration complexity: Even modern systems require thoughtful modeling to produce reliable KPIs.
Onware’s work — and this Tableau Conference session — is focused on solving these exact problems.
Need Help Building KPI Dashboards That Leaders Actually Use?
We’re grateful to everyone who attended the sessions at Tableau Conference and the Team DataFam user group. The engagement and questions reaffirmed how critical KPI dashboards are to the future of data-driven leadership in construction and industry.
If your organization is spending too much time preparing reports, struggling to trust its data, or finding that dashboards aren’t driving decisions, Onware can help.
Our team specializes in helping construction and industrial organizations connect ERP systems, build trusted data models, and deliver executive dashboards using Tableau and Microsoft Power BI.
From data warehouse design and ERP integrations to dashboard development, user training, and long-term business intelligence strategy, we help organizations activate their data and make better business decisions. Schedule a discovery call and find out what’s possible.