Actual vs. Committed
How we created an immersive Tableau dashboard for Project Managers to monitor construction project costs and identify budget variances
Client Profile
Client Profile
To improve Clark Builders’ Project Managers’ efficiency and effectiveness, we created an Actual vs. Committed Tableau dashboard, which brings job cost and budget information together into an immersive and all-inclusive visualization – making it easy to identify budget variances, cost trends and pinpoint details on impacted areas.
Introduction – The Job Cost Report
The Job Cost report is a common managerial tool in the construction industry. This measures project performance against the original and current cost estimates. Job costing breaks down a job or project into different activities or phases and helps identify variances in the results. In other words, it helps compare the budget estimates to the actual costs.
Senior Project Managers (PMs) and Project Executives may potentially manage hundreds of construction projects. Therefore, they are interested in quickly focusing on projects with large variances and identifying the project items causing the discrepancies. This can be especially important because budget overruns can greatly impact the bottom line.
In the past, it was a laborious process for PMs to determine estimated costs at completion. Consequently, it became difficult to perform their roles efficiently and effectively. It could take over a month to see the project’s progress as of the previous month. In addition, lack of visibility to expenditures results in unidentified cost issues or identified too late to react. Consequently, stakeholders need near-real time visibility of their project cost information. Tableau dashboards offer the perfect BI solution of data visualization to optimize construction analytics.
Three main reports are required for PMs at Clark Builders – an experienced construction service provider. Hundreds of pages of data were generated to help effectively monitor project costs and determine estimated cost at completion (ECAC).
Clark Builders is one of Canada’s leading general contractors with specialties in commercial construction, industrial construction, metals division, and construction management. A subsidiary of Turner, a North American based international construction services company, Clark Builders is a leading builder in diverse market segments. They operate from offices in Edmonton, Calgary, Vancouver, Saskatoon, and Yellowknife.
Clark Builders also provides advice and services on a direct and consultation basis. Primary functional areas include: Construction Management, Finance, Administration, Operations Support, Human Resources, Information Technology & Services, Professional Development, Safety and Environment, and Communications.
Challenges and Objectives
Challenges
- To monitor project costs, three reports are required:
- Job cost report: Summarizes the actual costs impacting each cost code (i.e. invoices from subcontractors, timecards, etc.)
- Project cost report: Provides an updated record of commitments, forecasts, and expenditures to identify budget variances
- Detailed job cost ledger: Lists itemized expenditures in the cost codes from the job cost report
- An average sized project can result in approximately 200 – 300 pages of data for the PMs to read through; it is time consuming and often not done effectively;
- It is difficult to cross reference cost codes to higher levels and identify any cost issues, such as budget overruns.
- Black and white pages result in difficulties because they are hard to distinguish from the rest of the data.
- Printed or exported reports are limited to cost information at a point in time. As a result, PMs are unable to identify cost issues and react in timely fashion. It was also difficult to look at cost trends over time.
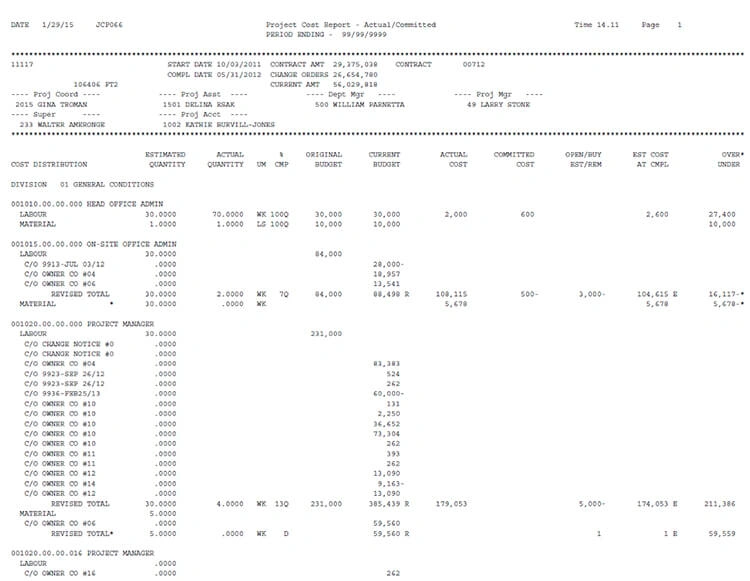
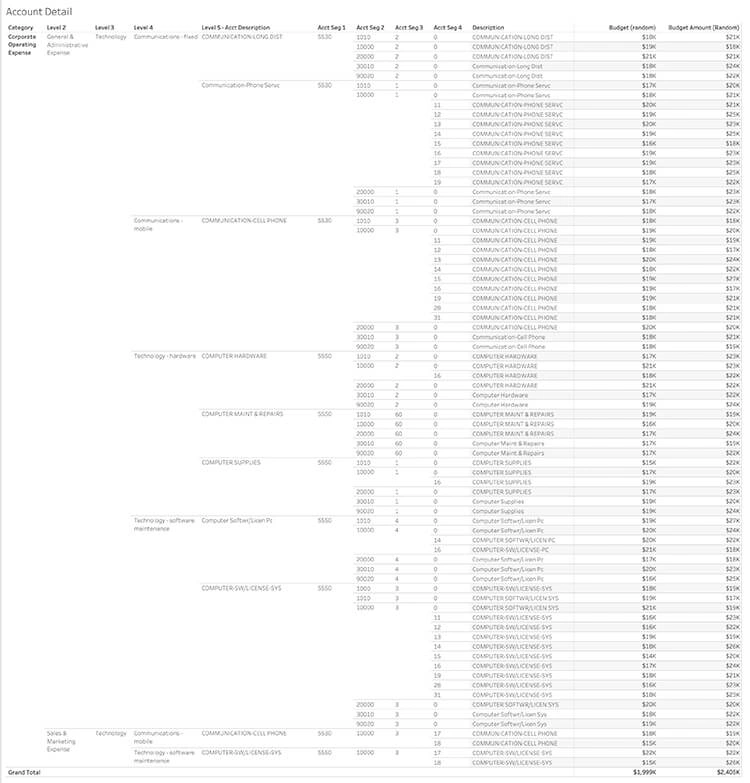
200-300 black and white pages of cost data
Objectives
- Create a single Tableau dashboard for PMs to quickly access up-to-the-minute data. Including visibility of original and updated budgets, change orders, costs, actuals, and more.
- Easily identify the project’s profitability and distinguish items of budget overruns at a glance.
- Implement ability to drill down from cost types levels, to cost codes, to transaction details.
- Include searchable parameters for PMs to quickly locate specific information, such as a vendor invoice or purchase order.
How We Helped: Making Job Cost Reporting More Efficient
“At the executive level, Tableau provides the ease of understanding financial information and helping to understand the trends and measuring KPIs.”
Marc Timberman, CFO
Using Tableau, we connected directly to Clark Builders’ financial system (eCMS by Computer Guidance Corporation) and created an immersive dashboard with cost information. As a result, the dashboard provided near-real time information for PMs and Executives to see their projects’ cost issues. Thus, allowing them to perform their jobs more efficiently and effectively, instead of spending hours summarizing and compiling reports.
Results: A Comprehensive Tableau Report to Monitor Actual vs. Committed Job Costs
“I see this software as an invaluable tool and benefit for reporting on financial metrics throughout our business.”
Marc Timberman, CFO
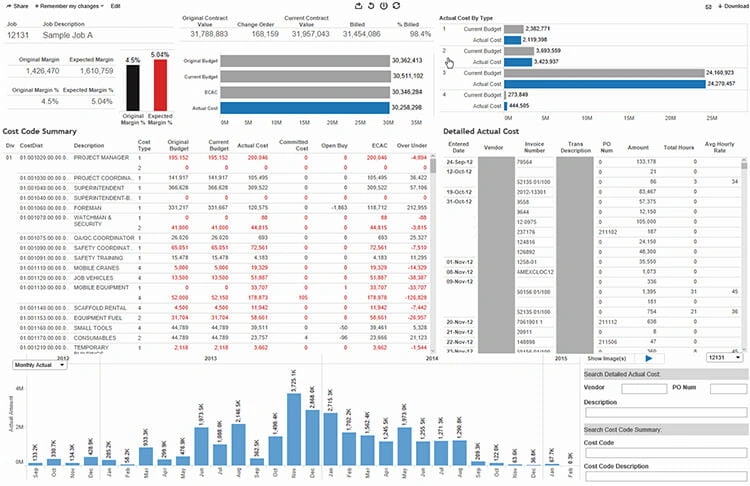
At a glance, PMs can see and compare the project’s profitability to the original budget. Furthermore, they have high-level visibility of important measures, like contract values, change orders, and amount billed. PMs can quickly identify the overall project budget, ECAC, and actual costs. Breakdowns of cost types (labour, materials, subcontract, and equipment) are readily available for instant evaluation of costs.
Even though the cost code summary provides a high-level of detail, PMs can effortlessly identify cost issues (highlighted in red). The dashboard’s detailed actual cost area lets PM to see transaction level detail without having to navigate to different screens.
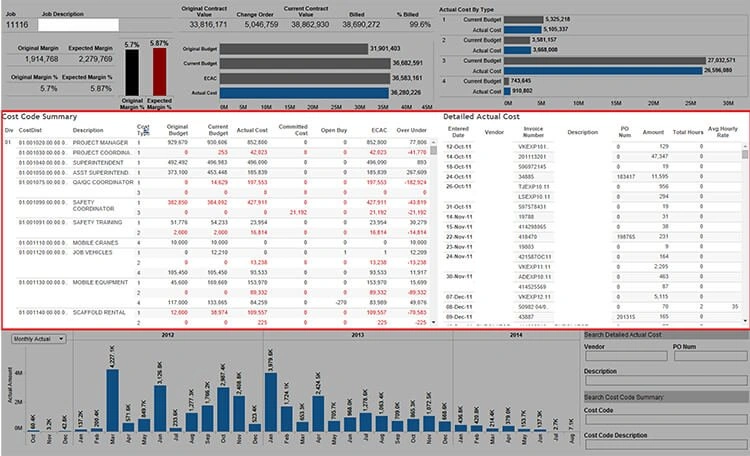
We helped link the detailed actual cost records to scanned vendor invoices to provide even more information and detail. Furthermore, we provided the ability to examine costs across the life of the project via two timelines: monthly actual costs and cumulative costs. These help to identify outliers, trends, and issues. To save space on the dashboard, only one version of the timeline is displayed at once, but the view can easily be toggled between the monthly and cumulative views. Since the entire dashboard is interactive, we gave the ability to filter by months. For example, by selecting the months, the detailed cost records are automatically filtered to the corresponding period.
Finally, through searchable filters, a PMs can quickly locate records by a vendor name, transaction description, PO number, or cost code.
Follow Up – More than Job Cost, Expanding Accessibility of Data Analytics Across the Organization
The Actual vs. Committed Tableau dashboard provided Clark Builders’ PMs with a valuable and powerful new tool on their jobs. Clark Builders made Tableau licenses available not just for PMs but also to Executive team members and Project Coordinators. Consequently, the same level of detailed data analytics and visualization became available to all key project stakeholders. In addition, this construction analytics project helped kickstart and provided inputs on other internal reporting initiatives, such as Monthly Operational Reporting.
Subsequently, Onware worked with other clients such as G.E. Johnson Construction (based in Colorado Springs, CO) and International Cooling Tower (Houston, TX) to build similar Tableau dashboards and visual analytics toolboxes. For example, we can create Tableau income statements and Tableau balance sheets.
Questions About BI Software, Data Analytics, and Data Visualizations?
At Onware, we have over extensive knowledge and experience building Project Management reporting for both large and small organizations. Whether it be with architects, construction owners, general contractors, engineers, government entities or services providers, we can design a custom-tailored solution that is built for your organization.
Call us and speak to one of our data experts and we will answer any questions you may have. Trust Onware to help you unleash your data through visual analytics. We offer “proof of concept” packages to connect your data to our set of starter dashboards.
Visit our website for more content including additional case studies, news and events, and tips and tricks to elevate your visual analytics. Follow our social media for updates in software, BI, and data.