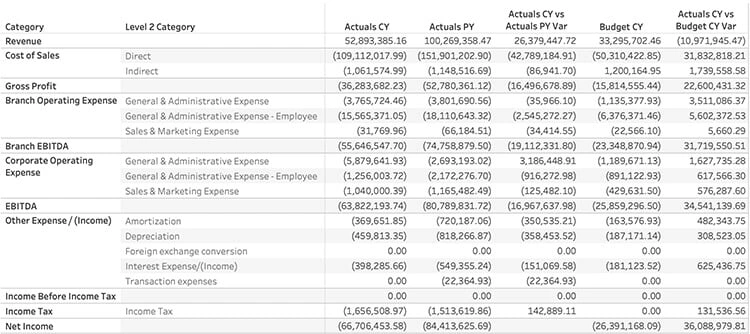
Consolidated Income Statement
Creating a combined Tableau income statement from multiple business units operating in both US and Canada
Client Profile

Client Profile

Through BI software, Tableau, we helped Thorpe automate their financial income statement process, and provided them with real-time interactive analytics and self-service for executives. With enhanced data governance, we can define access permissions and manage the construction analytics available for individual branches and their managers.
Thorpe, a construction engineering and plant maintenance service provider, has companies in Canada and across the US. In the past, they were required to export their trial balance every month for each company into Microsoft Excel and manually map the accounts and costs to create a financial income statement. This process resulted in significant amounts of data manipulation and validation, which is not only time consuming, but also limiting as it only provided a snapshot of data for a given time period. Using Tableau, we automated and connected to real-time data to build an interactive and detailed Tableau income statement.
Thorpe is a leading multi-craft industrial service provider with engineering and manufacturing capabilities for non-metallic corrosion-resistant equipment and materials, insulation services, high temperature systems, and industrial flooring and resurfacing systems for a variety of industrial plants.
Thorpe’s strength is the combined capability of coordinating technical and engineering requirements, self-manufacturing many of their solutions, and completing installations with experienced field crews. The result is better communication, shorter projects duration, lower life cycle cost, and enhanced safety with improved reliability for maintenance, retrofit, and capital projects. They are based in Houston, Texas.
Challenges and Objectives
Challenges
- Thorpe has seven operating companies – six in the US and one in Canada.
- Each company has a different account and are sub-divided into branches – 19 in total.
- In the ERP database, the companies are set up as individual silos, each with its own chart of accounts.
- There are foreign exchange considerations. One of the companies are located in Canada, and the executive wanted to see everything consistent in US dollars.
- Month-to-Month, Year-over-Year, and budget comparisons were required as well, thus, we had to include multiple data sources.
- Thorpe requested the ability to navigate from the Income Statement and drill down to the transaction level. The row count for all the transactions were well over one million.
Objectives
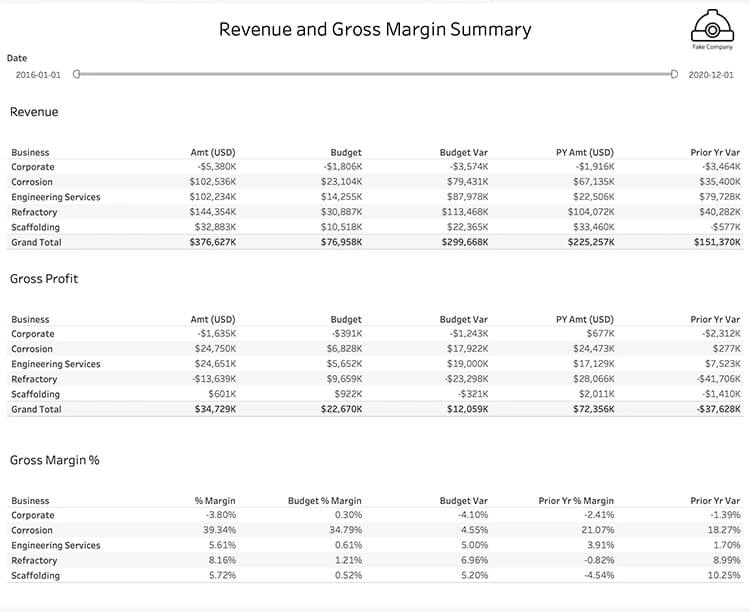
- Prepare the high-level consolidated Tableau income statement with comparisons
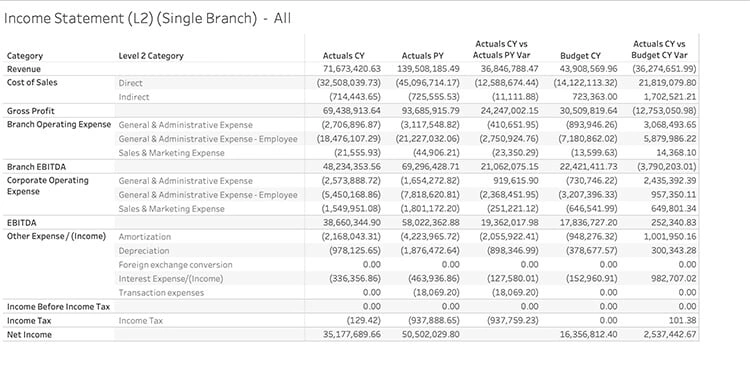
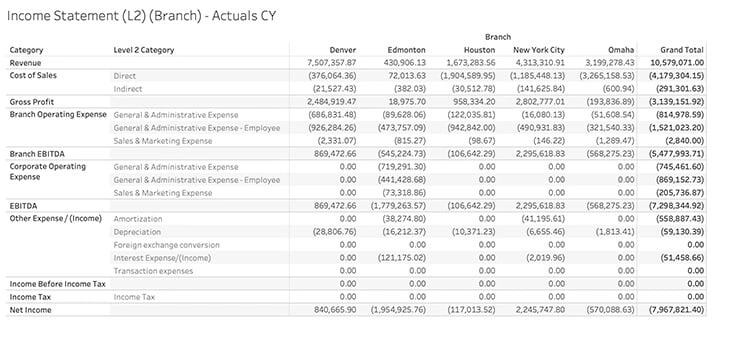
- Provide different levels of detail on the Tableau income statement, and allow filtering by branch/company
- Include month-to-month, year-over-year and budget comparisons
How We Helped Create a Tableau Income Statement
Initially, the requirement was to provide a financial income statement, but as we started working through things, the requirements started growing and getting more detailed.
Before arriving at the end result, we tried multiple solutions with Tableau. First, we used Excel for mapping the transactional tables; however, there were too many rows, and Tableau’s blending of data was not working well. In addition, it took minutes to refresh the views when we applied filtering; as a result, the income statement was not very usable.
In the second attempt, we tried to source the monthly transaction roll up tables provided by the ERP; however, this gave us account level summaries rather than transaction level detail. Blending was still used to get the previous year and budget data. Once again, it took long to refresh the views.
Our third attempt used a combination of a custom database query against the ERP to get the construction data we were looking for. This was combined with an Excel mapping of the chart of accounts to where they would appear on the Income Statement. Collaboration with Thorpe was essential in this step to understand what was required from the data source. Previously, they had generated their budgets using Excel, but we worked with the ERP’s built-in budgeting so that both the budget data and the transactional data were in the same location. Our custom database query sourced data from: General Ledger Actual Amounts (roll up by each month), Prior Year General Ledger (again, roll up by each month), and the budget. In addition, we combined the query with the Excel file containing the mapping of the account number to the income statement, and another Excel file that contains historical foreign exchange rates to convert CAD to USD.
Interested in how Onware can improve your organization’s contract administration? Connect with us.
Call and speak to one of our data experts, and we will answer any questions you may have about our contract administration construction software.
With over 20 years of combined experience in custom software development, BI, and data solutions, Onware can help you leverage data analytics to meet your organization’s needs.
Whether it be with architects, construction owners, general contractors, engineers, government entities, or services providers, we can design a custom-tailored solution that is built for your organization. We have experience building income statements and balance sheets for financial analysis, job costing reports, and many other software solutions for project management, sales, and logistics.
Results: An Interactive Income Statement in Real-Time
In the end, we created a series of Tableau financial reports used for board reporting and forecasting.
These included:
- Enhanced Data Governance: Branch level reporting with data source level filters, thus, branches can only see their data
- Interactive Dashboards and reporting: Drill down from high-level income statement to account-level summaries to individual transactions
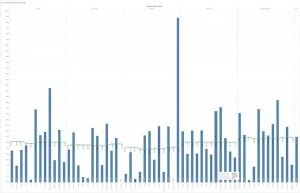
- Visual Analytics: Data visualizations for key performance indicator (KPI) tracking that included additional data sources (i.e. time sheets, budget re-forecast)
Process improvements included:
- Time saving and increased reporting efficiency: Automated data import/preparation to Tableau Online via Tableau Bridge
- Single Source of Truth straight from the data source: Less Excel manipulation since the views are aligned with the desired end-result
- Real-time data analytics for proactive rather than reactive decision-making: Real-time results to Branch Managers instead of having to wait for a manual process to complete
- Self-Service Analytics and less reliance on others: Self-service for Executives allowing them to get the details, if required, without having to ask employees
Questions About BI Software, Data Analytics, or Data Visualizations?
At Onware, we have over extensive knowledge and experience building Tableau financial statements, including income statements and balance sheets, for both large and small organizations. Whether it be with architects, construction owners, general contractors, engineers, government entities or services providers, we can design a custom-tailored solution that is built for your organization.
Call us and speak to one of our data experts and we will answer any questions you may have. Trust Onware to help you unleash your data through visual analytics; we offer “proof of concept” packages to connect your data to our set of starter dashboards.
Enjoy this post?
At Onware, we have over extensive knowledge and experience building Tableau financial statements, including income statements and balance sheets, for both large and small organizations. Whether it be with architects, construction owners, general contractors, engineers, government entities or services providers, we can design a custom-tailored solution that is built for your organization.
Visit our website for more content including additional case studies, news and events, and tips and tricks to elevate your visual analytics. Follow our social media for updates in software, BI, and data.
Consolidated Income Gallery
(all values are randomly generated)