With the abundance of data in construction, we are starting to see a growth of Construction Analytics and BI.
Construction: The Lagging Industry
According to McKinsey in 2020, construction is the largest industry in the global economy – representing about 13% of GDP. However, cost overruns and delays are still a commonality of projects, resulting in only 1% growth in the past two decades!
Construction is the largest industry in the world; however, spending on technology accounts for less than 1% of revenue. Only agriculture is less of a digitized industry. McKinsey attributes this to a large collection of firms in construction that does not have the time and money to invest in data and digitization. Furthermore, many firms have found success in the past without having to adopt construction analytics and BI (Business Intelligence) and the operational changes required.
In the typical construction lifestyle, owners spend months or years carefully planning the details of their project. Once completed, they will tender out to contractors who must consider delivering a project on time and on budget. In addition, contractors may propose change orders to help save time and money. The owner-contractor relationship is a tug-o-war with owners wanting the lowest price and contractors balancing the cost and schedules. Moreover, margins in construction are razor thin, thus, preventing contractors from investing in new technology that can help in the long run. However, as we have seen in every industry – markets that have not embraced technology and digitization – are ripe for disruption with innovation.
The Rise of Digitization and Construction Analytics and BI
The construction industry produces a vast amount of data daily. This data comes in various forms: blueprints, building models, cost estimates, cost transactions, and other construction documents. Now, it includes data captured from newer technologies like smartphones, wearables, drones, GPS systems, and other mobile solutions.
Every construction company can easily and inexpensively collect this data; however, the competitive advantages do not come from data itself. Rather, the analytics built upon the data and the actionable insights that come out of the analysis is what separates successful and unsuccessful data-driven organizations. Better data analytics will result in more accurate costs and timelines, which leads to improved budgeting and certainty on margins. Furthermore, it will help organizations become less reactive and more proactive in their operations.
Challenges Currently in Construction
Global consultants, Deloitte, believe the construction industry suffers from these common challenges:
- Repetitive reporting
- Multiple data systems
- Unprioritized and unorganized data
- Largely paper based reporting
- Lack of system connectivity
However, with modern business intelligence and analytics platforms, these challenges are now in the past. With the abundance of data, the construction industry is starting to look for ways to structure and analyze this data. Many different companies, including Onware, offer software solutions to help organizations make better decisions through actionable insights from their data.
Value of Construction Analytics and BI
Historically, analytics are expensive and require data scientists to perform complicated data analysis. However, this barrier to entry has been lowered with the emergence of Software-as-a-Service (SaaS). With tools like Power BI and Tableau, many organizations can now put data into the hands of their people to uncover explore their data and uncover actionable insights.
Data analytics is an investment, and with many investments, it may take some time before organizations start seeing results. While it is quite magical, things may not instantly get better. In many cases, deep data analysis leads to multiple smaller changes that ultimately add up to positive results.
Moreover, analytics does not have to be an enterprise-level commitment. Concepts and projects can be applied into smaller groups or projects; however, it is important to realize the more data analytics is applied to an organization, the greater the synergy and insights.
Here are some of the benefits of adopting to analytics:
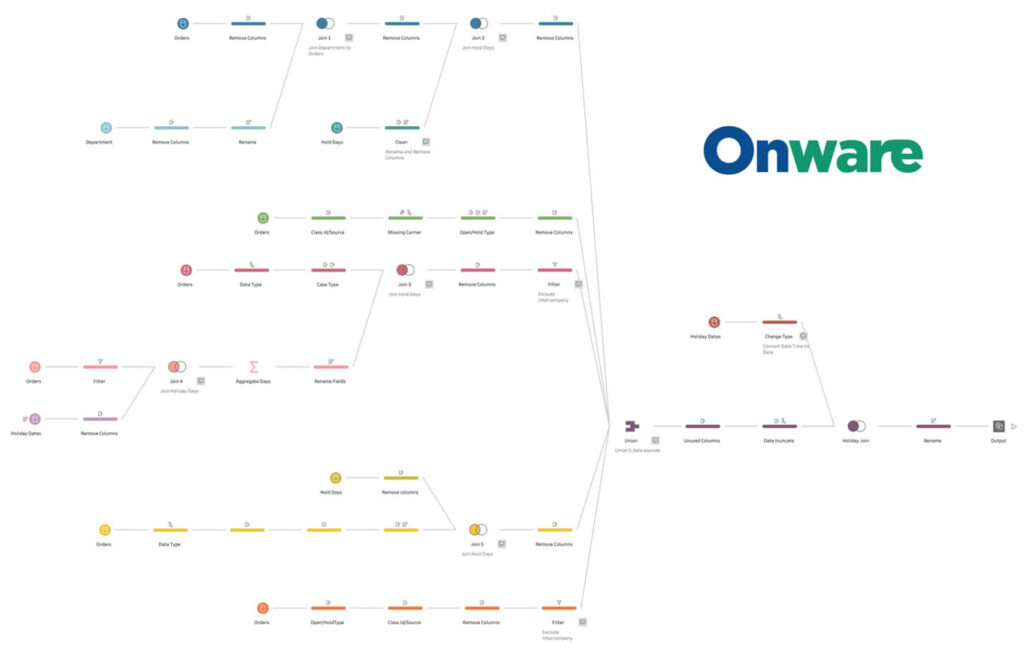
- Both structured and unstructured data collected from the disparate systems can be aggregated through ETL processes to generate consistent reporting
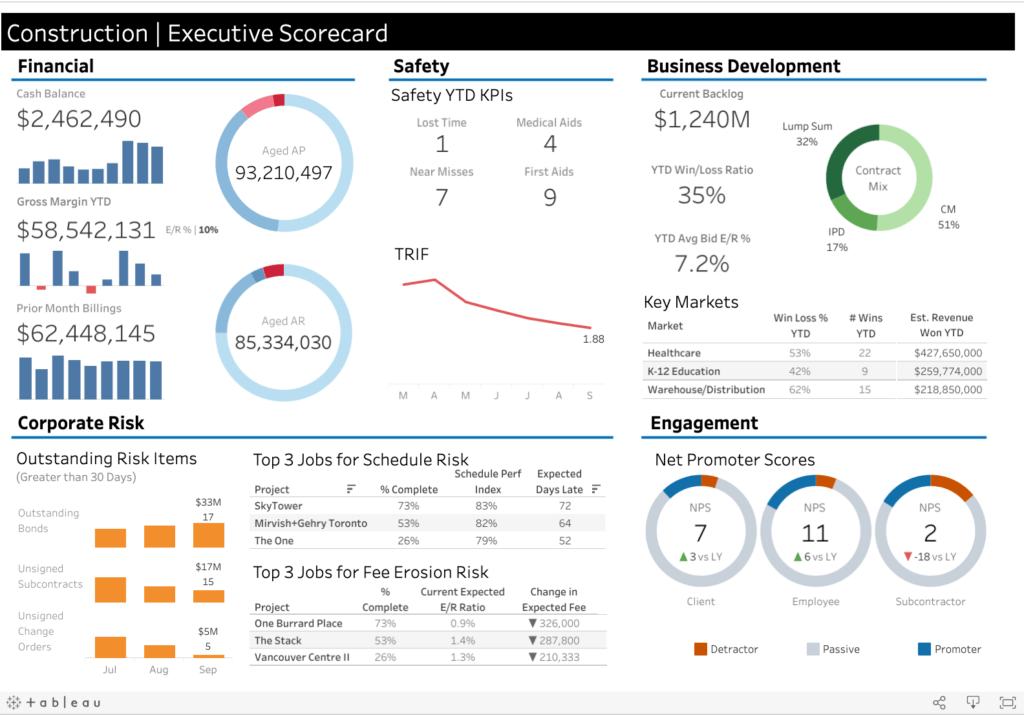
- Pages of hard data and numbers can be easily visualized in a clear and concise form. Helping with efficient interpretation and effectiveness, as well as quick insight to help with decision-making
- Self-service analytics provide clear reporting, directly from the source. Ensuring there is a single source of truth for the data
- Easier collaboration and sharing of dashboard and reports to others in the organization to help provide transparency and communication to the rest of the organization
We can Help Guide you on your Analytics Journey
With over 20 years of experience with data in the construction industry, we have helped many in the construction industry overcome pain points that prevent them from adopting analytics. Call and speak to one of our data experts, and we can help make your organization more data driven.
Whether it be with architects, construction owners, general contractors, engineers, government entities, or services providers, we can design a custom-tailored solution that is built for your organization. We have experience building income statements and balance sheets for financial analysis, job costing reports, and many other software solutions for project management, sales, and logistics
Enjoy this post?
Visit our website for more content including additional case studies, news and events, and tips and tricks to elevate your visual analytics. Follow our social media for updates in software, BI, and data. Follow our social media (LinkedIn and Twitter) for updates in software, BI, and data.


