Data, Data, Data
What is the amount of data generated daily? In 2017, IBM estimated the world was generating 2.5 quintillion bytes of data every day. This is equivalent to2.5 billion billion (or 2.5 x 10¹⁸) bytes of data.
As the digitization trend accelerates, organizations are collecting more data and in every aspect of their business. Collecting data is an easy task – every click, swipe, share, or search generates data. However, sorting through and analyzing large amounts of data for trends and insights is much more challenging. If every organization was good at analyzing data, we might not have any failing businesses!
Data can be very powerful, and can lead to valuable insights, resulting in competitive advantages, innovation, and business optimization. Organizations realize the potential of data analytics; thus, they are increasingly investing more into those capabilities. In fact, it is estimated that the data analytics market is valued at US$ 37.34 Billion in 2018 and expected to reach US $105.08 Billion in 2027.
Data Overload
While organizations only generate a fraction of the quintillion bytes of data, they have a lot of information available. It is likely businesses are creating data faster than they know what to do with it. Moreover, the amount of data collected will grow every year. As a result, analyzing all available data is overwhelming and inefficient.
There are good data and bad data. Good data can provide invaluable information on the business; however, bad data can be distracting and negatively impact your analysis. As a result, businesses hire data analysts and scientists to help sort through the abundance of data to identify actionable insights, so it can support highly informed decision-making.
What are Dashboards?
Identifying good data is important and usually placed into dashboards. Dashboard reporting visualizes the organizations’ key performance indicators (KPIs) in graphical form. Organizations use a variety of KPIs to measure performance across business units.
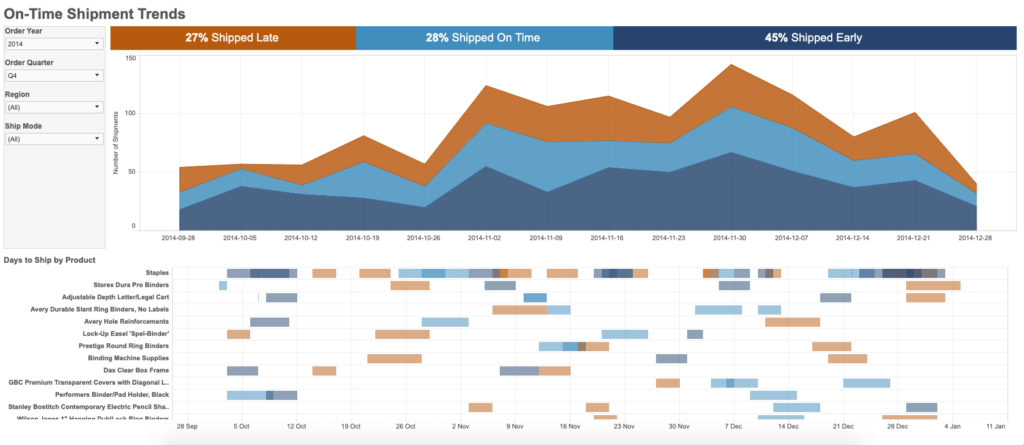
Modern dashboard reporting provides users the ability to interact with data on reports. These powerful reports allow users to drill down into details or slice data to analyze specific data sets. These modern reporting capabilities are particularly interesting for business executives, who require information quickly without having to navigate through numerous reports.
What about Executive Dashboards?
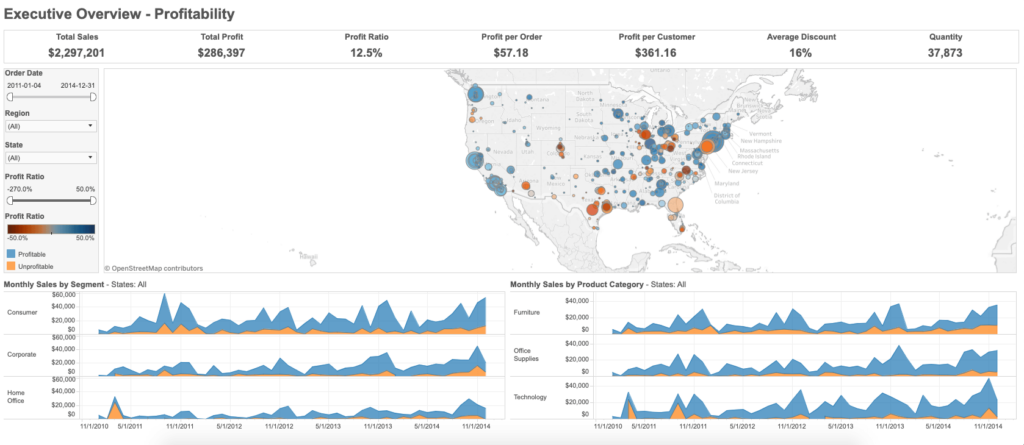
Executive, or sometimes referred to as strategic, dashboards provide business executives with a strategic and high-level view of their business. These dashboards present real-time metrics and data analytics that measure alignment between strategies, goals, execution, and results.
Executive dashboards are invaluable amongst management because it helps them measure performance, identify problems, and gain actionable insights. This is all possible while saving time!
Furthermore, these dashboards help measure performance of different business units, as well as the whole organization. As a result, it provides executives with a birds-eye view of their businesses, but with the ability to drill-down and inspect areas of interest.
Why are Executive Dashboards Useful?
Historically, tracking individual departments daily resulted in information overload as executives would have to spend significant time examining different spreadsheets. Most of the time, analysts were tasked with manually consolidating data from different sources into one spreadsheet or report.
As you can imagine, there may be a lot of manual effort to report building before businesses can find the answers to their questions. In addition, manual data processing can result in mistakes – copy and paste errors, broken formulas, etc.
Reports were also being shared back and forth via e-mail, creating confusion in finding the most recent revision. This can be frustrating and time consuming. For leaders and executives – whether they are running the reports themselves or getting someone else to do it – manual data processing is an opportunity cost for the organization. Luckily, this opportunity cost can be avoided by using modern data analytics, visualization, and BI tools, such as Microsoft’s Power BI and Tableau.

Investing in Tools for Executive Dashboards
It is easy to understand why businesses invest a lot of money into industry leading modern data analytic tools like Power BI or Tableau to help them make informed decisions through data analysis.
These tools save time for all employees by improving efficiency of reporting and analytics. It reduces the need for ad-hoc reporting as dashboards and reports are automatically updated as new data comes in. In addition, Tableau and Power BI dashboards can securely display data from many different sources – no matter where it is – and typically all in a central location – usually a web browser. Consequently, gone are the days of logging into different systems and platforms to individually track organizational performance.
The visual nature of executive dashboards and reports means it is easy to set their own input parameters, make sense of data analytics, see correlating metrics, spot ongoing trends, and take decisive actions that ultimately benefit the business.
The high-level view, coupled with the ability to drill down to seek greater details on specific pieces of information, saves valuable time by preventing the need to inspection multiple reports. Furthermore, it can help them better track enterprise performance, gain better real-time insight into enterprise or market dynamics, and respond faster to opportunities or crisis.
Looking to unleash your data through visual analytics? Connect with us at Onware.
Today, many of the BI software tools are useful in collecting and managing data and helping to increase productivity within the organization. However, many like the accounting software, Quickbooks, or the Financial Enterprise Resource Planning (ERP) systems from Oracle and SAP have limited reporting capabilities that do not quite answer all the questions you may have about your business.
Onware Business Solutions understands that executive dashboards are powerful tools for the modern CEO. We help their organizations become more efficient. We use Tableau or Power BI to securely bring in data from different ERPs for consolidated and dynamic executive dashboards. These dashboards provide real-time data to help save time and costs, as well as making their business become more intelligent.
We know every business is unique; therefore, whether you need information from income statements and balance sheets, or job and project cost information, we will provide a custom-tailored solution for your needs. Organizations from various industries – including government entities, service providers, consultants, and others in the Architectural, Engineering, Construction and Operations – trust Onware to help develop executive dashboards for their executives.
Contact us today and let us help you unleash your data into actionable insights!
Enjoy this post?
Visit our website for more content including additional case studies, news and events, and tips and tricks to elevate your visual analytics. Follow our social media for updates in software, BI, and data. Follow our social media (LinkedIn and Twitter) for updates in software, BI, and data.


