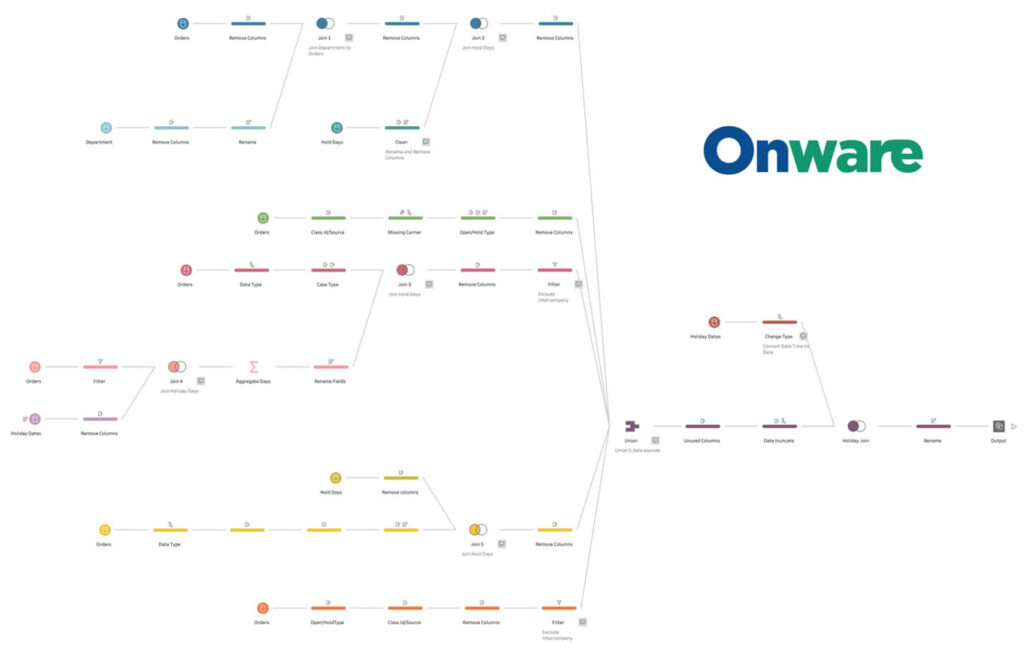
When you look at a data analyst’s workflow, you might think most of their time is spent analyzing data. However, a 2016 survey by CrowdFlower reveals 60% of surveyed data analysts spend most of their time cleaning and organizing data. Data preparation is critical in producing accurate data analytics, but it is time consuming. As a result, ETL tools that help with data preparation, such as Tableau Prep, Microsoft Power Query, and Alteryx Designer, are becoming more popular than ever before.
What is ETL?
ETL is the process of combining data from multiple sources into a centralized database, such as a data warehouse, through three steps: Extract, Transform, and Load. Many organizations store data across multiple databases, and thus, use ETL. In order for Business Intelligence (BI) software, such as Power BI and Tableau, to draw quick insights from data, it is essential to bring data together in an organized manner. ETL has three main processes:
Extract
Exporting raw data from various structured or unstructured sources, such as:
- SQL servers
- ERP systems
- Spreadsheets
- Mobile apps
- Emails and text files
Transform
Refining the extracted data to ensure data quality, integrity, and compatibility with the destination source. The transform step is equivalent to data preparation and can involve:
- Filtering missing, blank, or unusable values (e.g., null cells)
- Reformatting for consistency (e.g., dates, row and column headings)
- Removing duplicate values (i.e., deduplicating)
- Sorting data (e.g., ascending alphabetical order)
- Applying calculations (e.g., unit conversions)
Load
Importing transformed data into the destination database. There are two loading methods:
- Full refresh: Importing all the data at once and periodically overwriting all records with new data
- Incremental loading: Importing data in batches and periodically appending new data once they become available
Why is ETL important?
According to Statista, 64.2 zettabytes of data will be created, consumed, and stored globally in 2020. This is equivalent to over 64 billion 1 terabyte hard drives – a number set to more than double in 2025. The world has a lot of data, but they are not all stored in the same place. In fact, external data that may be useful to your organization can be scattered across data servers in several countries. Thus, you can imagine how the structure and notation of data can vary drastically! Take this list of equivalent British and American English words, for instance:
| British English | American English |
| Football | Soccer |
| Crisps | Potato chips |
| Biscuit | Cookie |
The table is merely one example of how data sources can differ. These variations can occur not only from country to country but within the same organization: from one department to another, and one employee to the next.
Moreover, data silos, where data is isolated within each department and not shared across the entire organization, can contribute to inconsistencies in data. As organizations collect more and more data using different systems, e.g., sales data from Point of Sales systems or app usage from customers’ phones, analysts must often work with data in different sizes, shapes, and forms. Therefore, ETL is an important process for resolving these discrepancies, so data can be analyzed from various sources.
What is an ETL tool?
In short, ETL tools are software that automate the manual process of writing code to perform ETL.
A major benefit of using an ETL tool is it saves time. As a result, analysts can prepare more data for analysis and discover in-depth insights.
Another benefit of using an ETL tool is users can perform ETL without coding knowledge. Instead, the code runs in the background, and users simply interact with the tool’s graphical interfaces. For example, “no-code” actions may include:
- Dragging and dropping to combine different data sets
- Editing values of multiple records at once
- Filtering values with a single click of a button
In contrast, here are some of the same data cleaning functions handwritten as code.
By simplifying the task of data preparation, ETL tools makes data analysis more accessible to different stakeholders in an organization. Many ETL tools are also available online on a web browser, e.g., Tableau Online and Microsoft Power Query Online. Compared to a locally installed application, an online ETL tool mitigates version incompatibility.
Let’s look at an example of an ETL Tool: Tableau Prep Builder
Tableau Prep includes two products: Tableau Prep Builder and Tableau Prep Conductor. Tableau Prep Builder is Tableau’s ETL solution available to users with a Tableau Creator license. Tableau Prep Conductor is an add-on in Tableau Online or Tableau Server.
Tableau Prep Builder
Tableau Prep Builder is structured in three panes, ordered from top to bottom:
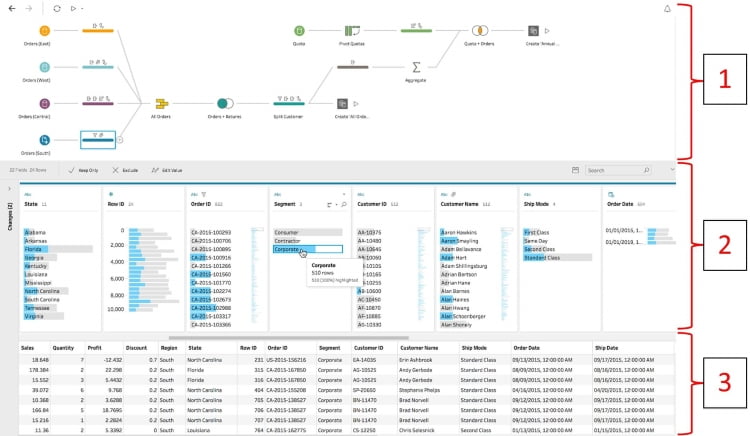
- Flow pane – Inspired by subway maps, visualizes the data flow, i.e., the series of actions applied to transform input data into the desired output
- Profile pane – Provides the distribution of data per field, so users can easily identify outliers
- Data grid – Shows the data by row, so users can immediately see the effect of transformations on the data
Once you connect your data sources to the tool, you can create data flows. Tableau Prep Builder’s key functions are summarized below. Watch Tableau’s how-to videos to learn how to perform these transformations step-by-step.
Pivoting
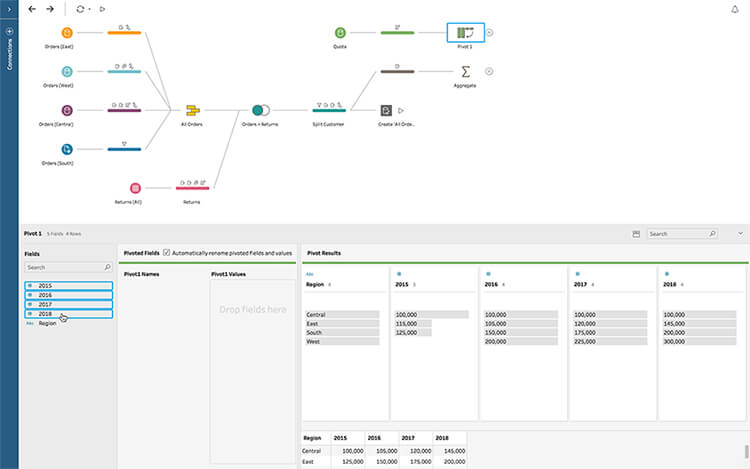
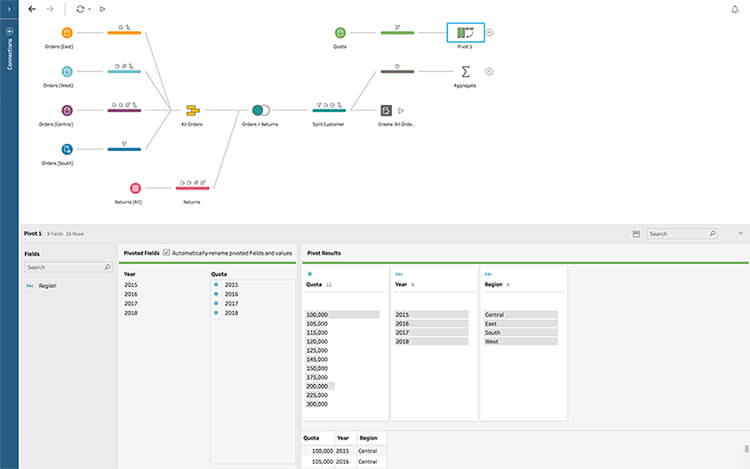
- Add a Pivot step (outlined by a blue box in the Flow pane) to summarize data by grouping records (rows) of a table by their fields (columns)
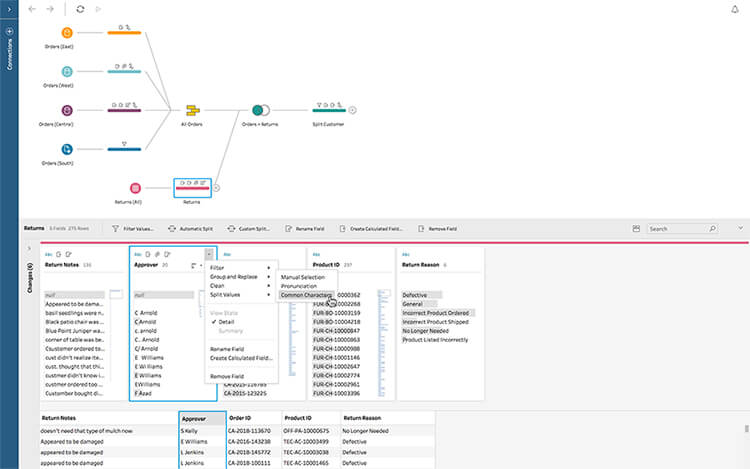
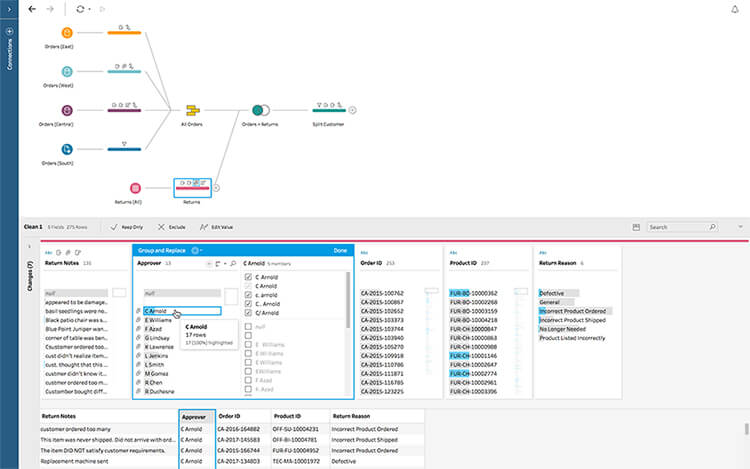
Group and Replace (AKA realiasing)
- Add this Clean step to group equivalent values into one (e.g., AB and Alberta) and edit multiple values at once (e.g., correct all records that are misspelled)
Join and Union
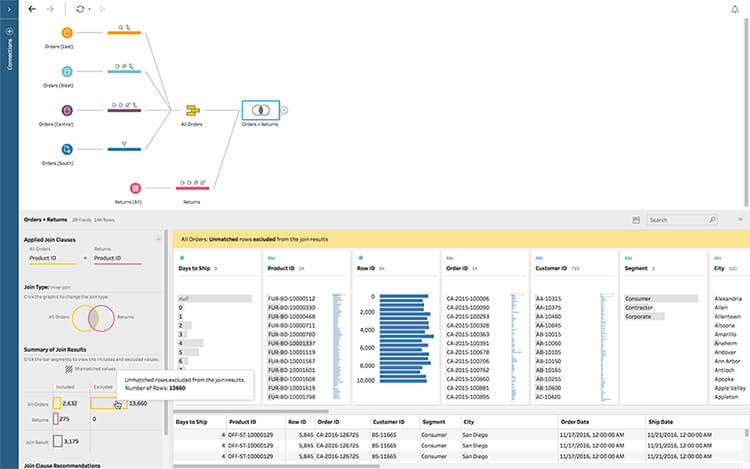
- Add a Join step to merge data from two or more tables using common fields
- Expands a table horizontally
- Inner join: Returns records that have matching values in both tables
- Left (outer) join: Returns all records from the left table, and matched records from the right table
- Right (outer) join: Returns all records from the right table, and matched records from the left table
- Full (outer) join: Returns all records when there is a match in either left or right table
- Add a Union step to append records from one table to another table with matching fields
- Expands a table vertically
Aggregation
- Add an Aggregation step to group records in a single table by a certain field
- This step is often done before a Join or Union step to combine multiple tables together
Filtering
- Click on the drop-down arrow on the Profile pane to exclude outliers or unwanted values
- E.g., there are filters by calculation, values, dates, and relative dates
Tableau Prep Conductor
Tableau Prep Conductor is a tool accessed through the Data Management Add-on in Tableau Server or Tableau Online for managing data flows. This component of Tableau Prep emphasizes the “Load” step in ETL. Notable features include:
- Automatically running flows to produce up-to-date output data
- Notifying failures and errors in running flows
- Viewing scheduled and past flow runs
Looking to unleash your data through visual analytics? Connect with us at Onware.
Call and speak to one of our data experts, and we will answer any questions you may have. We are experienced with created consolidated reporting, no matter where your data resides. Ask us about combining multiple data sources in Tableau Prep to create company-wide consolidated financial reports, including income statements and balance sheets. We are experts in ETL, so we can help unify your organizational data.
With over 20 years of combined experience in custom software development, BI, and data solutions, Onware can help you leverage data analytics to meet your organization’s needs.
Whether it be with architects, construction owners, general contractors, engineers, government entities, or services providers, we can design a custom-tailored solution that is built for your organization. We have experience building income statements and balance sheets for financial analysis, job costing reports, and many other software solutions for project management, sales, and logistics.
Enjoy this post?
Visit our website for more content including additional case studies, news and events, and tips and tricks to elevate your visual analytics. Follow our social media for updates in software, BI, and data. Follow our social media (LinkedIn and Twitter) for updates in software, BI, and data.
References
IBM Cloud Education. (2020, April 28). ETL (Extract, Transform, Load). Retrieved from IBM: https://www.ibm.com/cloud/learn/etl#toc-etl-and-ot-NiTFjp1v
SAS. (n.d.). ETL. Retrieved from SAS: https://www.sas.com/en_ca/insights/data-management/what-is-etl.html
Tableau. (2021, July 8). Tableau Prep Help. Retrieved from Tableau: https://help.tableau.com/current/offline/en-us/tableau_prep.pdf#v-d-alt
Tableau. (n.d.). Tableau Prep Builder & Prep Conductor: A self-service data preparation solution. Retrieved from Tableau: https://www.tableau.com/products/prep
Talend. (n.d.). What is Extract, Transform, Load? Definition, Process, and Tools. Retrieved from Talend: https://www.talend.com/resources/what-is-etl/

