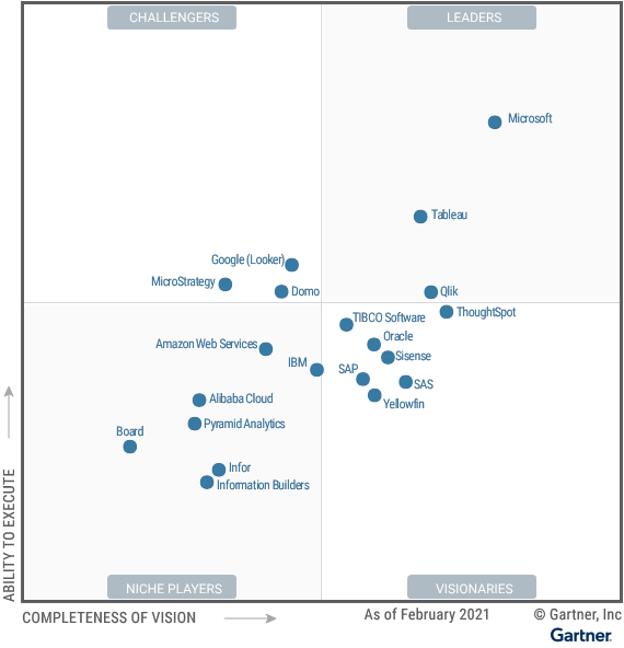
Overview of the 2021 Gartner’s Magic Quadrant
Gartner, a global research and advisory firm, published its most recent Gartner’s Magic Quadrant for Analytics and Business Intelligence Platforms. Like in previous years, Microsoft and Tableau are the clear leaders in modern Analytics and Business Intelligence (ABI) platforms. This should come as no surprise, as both Tableau and Microsoft have been consistently positioned as leaders for many years.
Compared to last year, Microsoft is by far the runaway in both execution and vision and has increased the gap on Tableau. This year, Thoughtspot has dropped out of the Leader Quadrant, leaving only Qlik, Tableau and Microsoft as the Leaders in ABI Platforms.
Microsoft’s Power BI has experienced tremendous user adoption over the past year due to reduced pricing with its bundling with Microsoft’s Office 365 (E5 level). It looks to continue its momentum with the importance of remote work and its integration with Microsoft Teams.
Onware Business Solutions partners with both Microsoft and Tableau. As a result, we will focus solely on these two platforms. We offer years of expertise in consulting and reselling services for both Business Intelligence platforms.
Gartner’s Magic Quadrant, Analytics and Business Intelligence Platforms, and Why it is Important.
“The market for self-service ABI platforms continues to grow at speed. The construction industry is embracing the use of these platforms to help ensure on time and quality delivery of projects.”
Dean Doige, Gartner Executive Partner
Gartner’s Magic Quadrant is a series of market research reports that uses qualitative research and analysis to evaluate positioning of technology vendors based on defined criteria and their relative strengths and weaknesses.
Technology vendors are positioned based on client interactions, vendor strategy days/briefings, RFPs, vendor videos, vendor questionnaire and evaluation of each product.
In this report, Gartner emphasizes self-service and augmentation, while being easy-to-use with a full analytic workflow – from data prep to visual exploration and insight generation.
Some would call Gartner’s Magic Quadrant the “Consumer Reports” of software. Large enterprises will use it to narrow down their top choice for ABI platforms. However, we believe this is only one tool – in many – that helps you make your decision. Every organization is different, so we emphasize using a variety of data and tools for your evaluation.
What determines Completeness of Visions (Y-axis)?
Several important factors are used to determine vision completeness including market understanding, marketing, offering, sales, industry, geographic strategy, as well as innovation.
What is ability to Execute (X-axis)?
Execution is largely based on input from consumers and based on product capabilities, overall viability, sales execution and pricing, ease of use, customer experience, business benefits, market responsiveness, track record, and others.
Microsoft Power BI and Tableau

Microsoft has both a comprehensive and visionary product roadmap with significant market reach through its Microsoft Office products. Power BI offers data preparation, visual-based data discovery, interactive dashboards, and augmented analytics. Moreover, Power BI Desktop can be used as a stand-alone, free personal analytics software.
Strengths
- With its low price point and inclusion into Office 365 makes it the automatic choice in many organizations.
- There will be increasing integration of Power BI into Microsoft Teams (which has millions of daily active users). Microsoft looks to continue its momentum with high user adoption – especially with the growth of remote work.
- Power BI has played a pivotal role in reducing the price of tools in the overall ABI platform market. In the case of Power BI, reduced price does not mean limited functionality; in fact the opposite is true. Power BI offers many capabilities, including augmented analytics, machine learning, AI-powered services (available with Power BI Premium), and leverages the potential from Azure.
- After its 2019 updates, Power BI Pro cloud services functionality improved more than most of its competitors. We saw innovative capabilities for augmented analytics and automated ML. By leveraging Azure’s capabilities, Power BI implemented AI-powered services, such as text, sentiment, and image analytics. Microsoft is likely to increase the visionary capabilities of many of its products and integrate them with Power BI. It recently announced integration with Azure Synapse analytics, a “limitless analytics service with unmatched time to insight”.
Cautions
- Compared with its cloud service, Microsoft’s on-premises offering has significant functional gaps, including dashboards, streaming analytics, prebuilt content, natural language Q&A, augmentation, and alerting. None of these functions are supported in Power BI Report Server.
- Microsoft is more inflexible as its offering runs only in Azure.
- Due to its one-to-one relationship between published Power BI apps and workspaces, there may be an administrative burden on organizations as they are required to manually manage hundreds of workspaces. However, Microsoft recognizes this and are investing on governance that may help quickly change this.

Tableau enables users to access, prepare, analyze, and present findings in their data through a visual experience. It has powerful marketing and expanded enterprise product capabilities. In addition, it accelerated its innovation with new augmented capabilities, new analytic features, as well as new data and server management products. However, its new integration with Salesforce Einstein Analytics (now renamed Tableau CRM) remains a work in progress.
Tableau enhanced many of its data preparation and management capabilities in 2020. This includes easier analysis of data across multiple tables and at different levels of detail and offering Tableau Prep Conductor and Tableau Catalog for a unified experience in operating and automating data management and understanding data lineage. Integration of predictive modelling abilities from Salesforce Einstein Analytics will be something to watch for in March 2021.
Strengths
- While adding new functionality, Tableau has always maintained a clean and seamless user experience to perform analytics. As a result, Tableau’s overall experience score is well above average with users continuing to show a fanlike attitude towards the product.
- Tableau’s VizQL engine has been a large differentiator between its competitors and offers an intuitive analytics experience with rich functionality.
- Salesforce is likely to start offering an integrated experience with its products. Tableau’s Viz Lighting web component already offers a simplified experience of integrating Tableau visualizations into Salesforce. With its Mulesoft data connector and its recent purchase of Slack, we personally, look forward to what are in its integration plans.
Cautions
- Speaking of integration, it has taken some time to integrate Salesforce with Tableau (and we would not be surprised it will take some time with Slack). For those users that want to take advantage of augmented analytics from Einstein Analytics in Tableau (automated data stories, key driver analysis, custom automation, and explainable AI), it remains a work in progress as it is not fully integrated.
- Compared to other cloud vendors in the market, Tableau is expensive. Tableau CRM has an extra cost for each user per month. These added costs will impact customers who are planning to scale their deployments. In addition, the cost will remain a significant challenge compared to Microsoft, the leader of this market. In response to Microsoft, Tableau has eliminated their minimum license requirements on Tableau Explorer and Viewer licenses.
- Tableau offers cloud-hosted solutions, but it does not have cloud-native architecture for on-premises customers to fully embrace the cloud’s benefits. According to Gartner, other than Tableau Online, it cannot utilize the cloud’s elasticity to automate scale out to handle dynamic workloads. Tableau is planning deployment of Tableau Server in a containerized infrastructure in 2021.
What does it mean for you?
As Gartner outlines, there are strengths and weaknesses for both Microsoft and Tableau. Ultimately, the decision between the two may be based on your needs and current infrastructure. Both are clear top-in-class and market leaders and used by millions of people all over the world.
If you are unsure which solution is best for you, Onware Business Solutions is here to help! We have extensive experience using ABI platforms for tasks such as monitoring volume or resolution times, workload distributions, sales and KPI tracking, construction and project management, budget administration and financial analysis. Our clients range from small to large organizations, including general/sub/specialty contractors, government entities, construction owners, service providers, architects, engineers, and consultants. Every organization is different and may require a custom-tailored solution – we will help you find that solution.
Contact us today and let us help you unleash your data.


