DIALOG uses Onware’s Contract Administration software. Thus, we have a comprehensive understanding of the data and the data environment. We connected Tableau to our database and created dashboards with live data to show report cards for Construction Analytics based on the following criteria: active items and aging on documents, contractor scorecards, submittal tracking, and project contractor administration reports. Furthermore, we set up weekly automated emails to project executives and managers, so they can have a quick overview of how their projects are doing week-to-week.
Introduction
Successful companies recognize the importance of managing projects through efficient and organized documentation management. Construction analytics, including identifying, accessing and tracking documentation creates an environment that promotes on-time and profitable projects. Construction management through monitoring documents, such as Requests for Information (RFIs), is important because late/no responses can lead to time delays, budget issues, and legal consequences.
RFIs are typically used to clarify uncertainties and gaps in information for specifications, plans, contracts, or other documents. A simple RFI may only involve one main consultant interacting with a contractor for information; however, complex RFIs may require coordination between multiple consultants and subcontractors. Therefore, as more stakeholders are involved documentation management becomes increasingly important. According to a Navigant Construction Forum survey of 1,400 projects, there is an average of 9.9 RFIs for each $1 million of construction worldwide, and 25% of RFIs received no replies. Data from Onware’s Contract Administration software shows that large Canadian institutional and healthcare projects average around 30 RFIs.
Based on the statistics from Navigant Construction Forum, documents, like RFIs, can considerably impact project planning and budget. Consequently, lack of response to documents can cause costly disputes, budget overruns and late completion of projects. Document management can be manual and tedious. Many organizations track project documentation through emails, spreadsheets, or even pen and paper. This is not only ineffective but can result in disputes if not managed properly. Thus, effectively and efficiently tracking and monitoring documents digitally is important. In fact, Navigant Construction Forum recommends using software to monitor and track documents for every project.
Client Profile

Our client, DIALOG, is a multi-disciplinary collaborative team of architects, urban planners, interior designers, and engineers that design for urban vibrancy, health and wellness, transportation, education, arts and culture, residential, retail, commercial, and mixed-use solutions.
There is an increased complexity to track the organization’s data due to the large size of DIALOG’s team and range of services. Consequently, DIALOG uses Onware’s collaborative construction management software to help centralize project data and track important documents, such as RFIs.
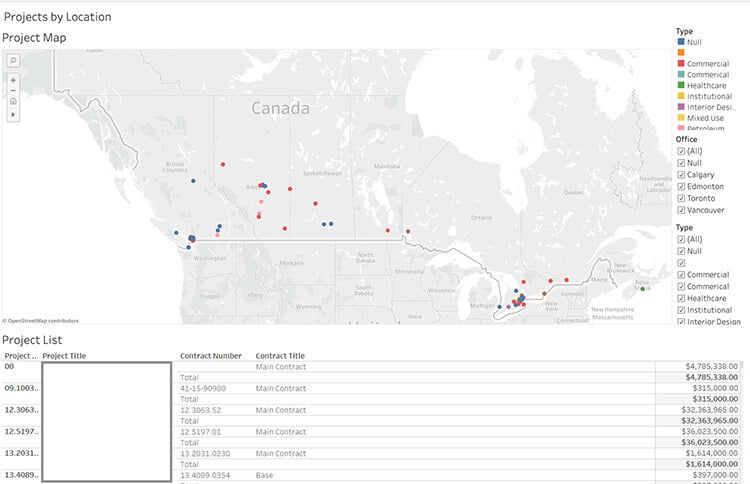
DIALOG is located in Canada (Edmonton, Calgary, Vancouver, Toronto) and the US (San Francisco).
Challenges and Objectives
Challenges
- Create Tableau dashboards to monitor active items/documents that require action.
- Implement Tableau dashboards and reports to track time taken to respond to active items.
- Provide Principals with an overview of projects they are responsible for.
Objectives
- Create Tableau dashboards and reports that shows active items, aging for documents on projects, changes, submittals, progress claims, RFIs.
- Implement drill down ability in data visualizations and dashboards to view details of documents. Find out which ones require action, which project they are in, and who is responsible. Maximize the potential of construction analytics.
- Provide Principals with weekly report card emailed directly to their inbox. Consequently, providing a quick view of projects to determine if any actions are needed.
How we Helped DIALOG’s Construction Analytics
DIALOG uses Onware’s Collaborative Contract Administration software, a cloud-based software. It offers transparency and accountability in the document management process by creating, managing, and distributing project documents across departments. Onware’s software has helped track millions of construction and design documents for DIALOG.
Our tool serves as an important central repository for users to view and action documentation anytime. By connecting Tableau with our Onware database, we created various construction data visualizations and dashboards. With real-time reporting, project executives can get up-to-date information to see and understand their projects. We created five main modules to help DIALOG manage their construction projects.
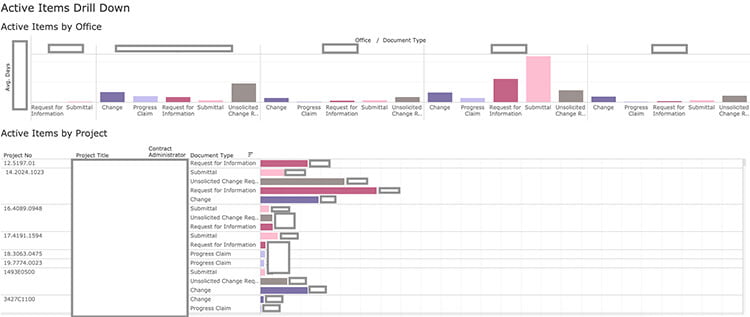
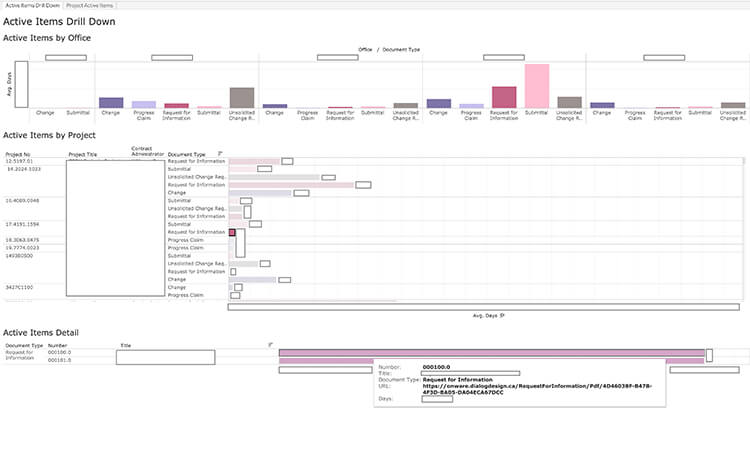
Active Items
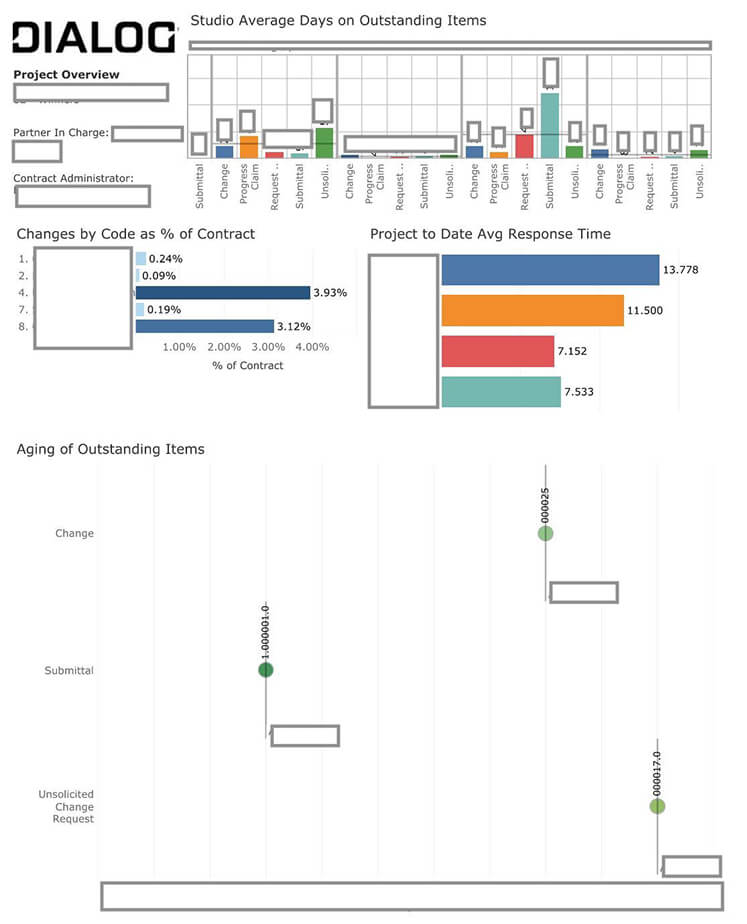
The Active Items dashboard shows active items by location, document type, and by project. Users can drill down to look at the individual documents and click through to view them in their web browser.
Change Management
To see the changes being made to contracts, we created a series of Change Management dashboards. Moreover, they can see whether it was an internal or external change. These show the type of change made, (e.g. scope change), the amount, and details.
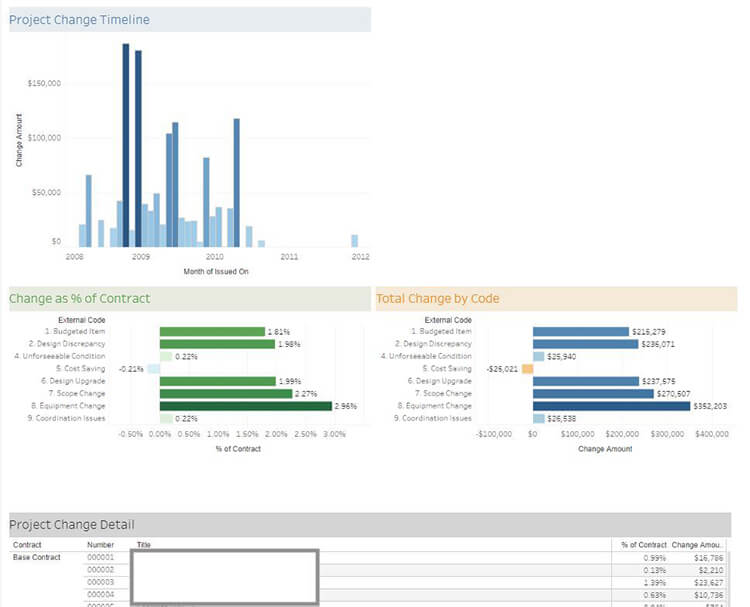
Additional dashboards show details and turnaround times for changes, review the price, issue the change order and more. Finally, we included a report card for turnaround times by studio and individual Contract Administrators.
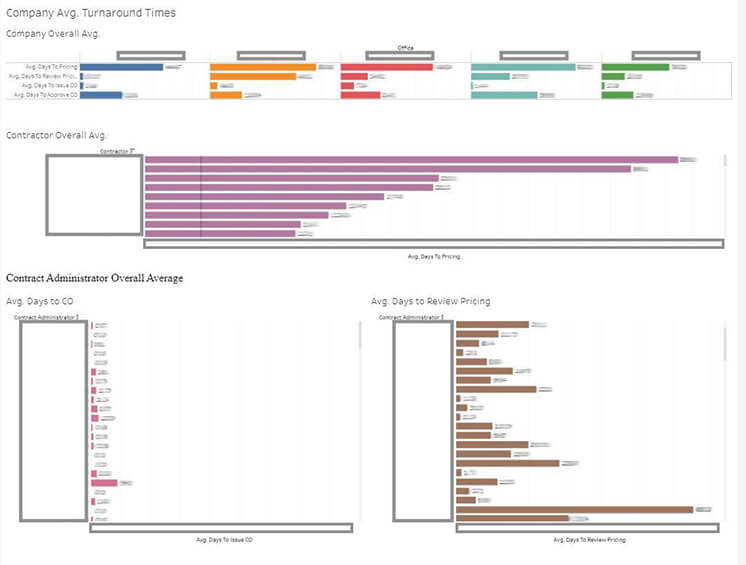
Performance Report
A Performance Report module was created and used scorecard to see the length of time the company and contractors/consultants take to respond to active items. These dashboards also allow for a comparison of contractors/consultants based on their average response times and types of documents they generated on past projects. When starting new projects, this information is useful for assigning consultants to project teams based on their past performance.
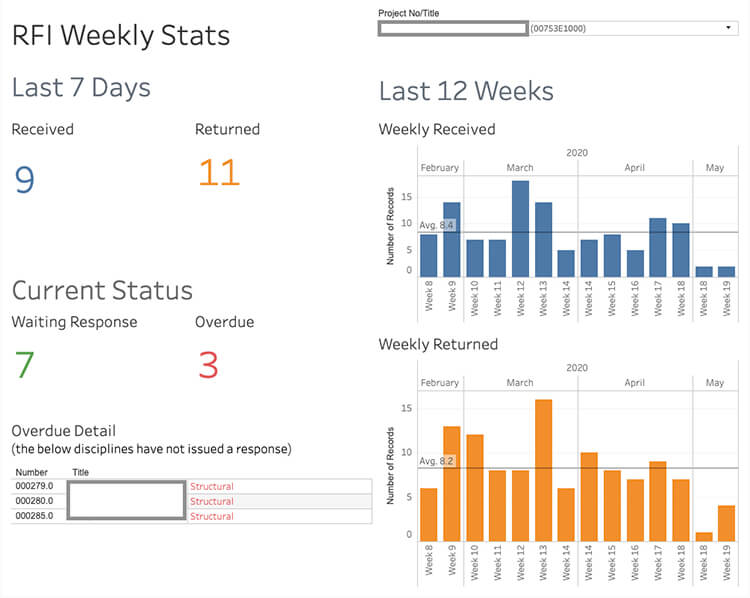
Project Stats
This dashboard shows Principals and other stakeholders statistics for weekly submittal and RFI activity. These dashboards are well suited to subscription e-mails. The collaborative nature of Tableau gives any project stakeholders, including Owners, access to reporting, without having to rely on Contract Administrators to generate and export reports.
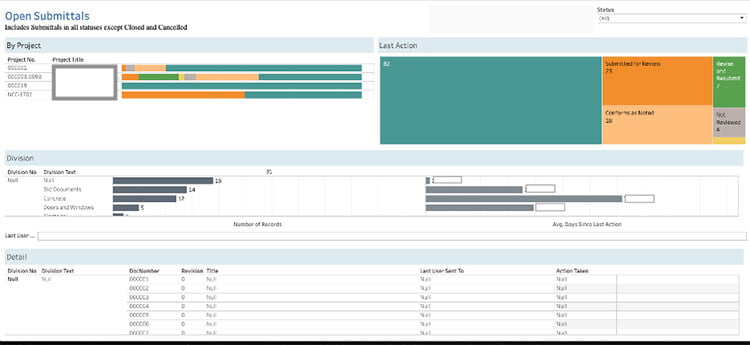
Submittal Tracking
To help track shop drawings and other contractor submissions, we helped DIALOG create a submittal tracker, so Document Controllers can view where documents are in the process, across all active projects. Ensuring documents are not delayed is very important because architects and engineers must approve plans that comply with the contract before the project can proceed.
Results: An Immersive Construction Analytics Experience
The Tablea dashboards allow project teams to quickly see which types of changes are most common for outstanding documents. In addition, executives can filter to see all projects and active document types associated with each studio. This not only promotes healthy internal competition between studios but also allows them to validate studios that have abnormally large values. For example, DIALOG discovered that some active items with large response times were due to gaps in process. Some projects were not closed properly, others had Contract Administrators that were no longer active.
In addition to displaying important information about active items and documents, many of our dashboards implement a drill down functionality. This allows for someone to find details about the active item. Furthermore, we built tooltips showing the document number and title; clicking on an item will redirect the user to the actual electronic document in Onware.
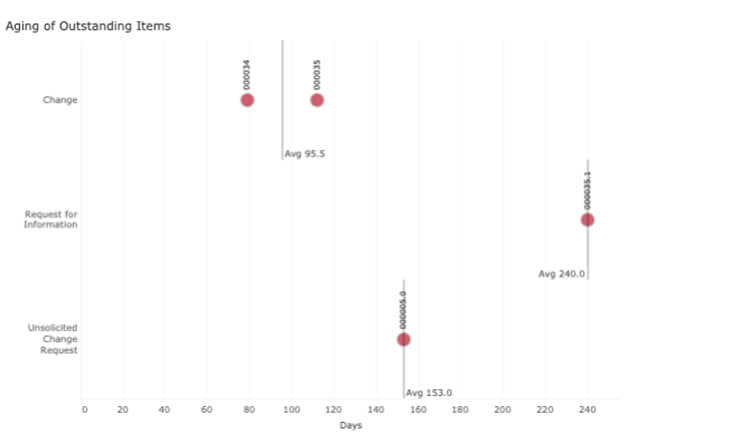
We included an aging chart to indicate average response times to documentation. Once again, clicking on the data points will redirect the user to the document on Onware.
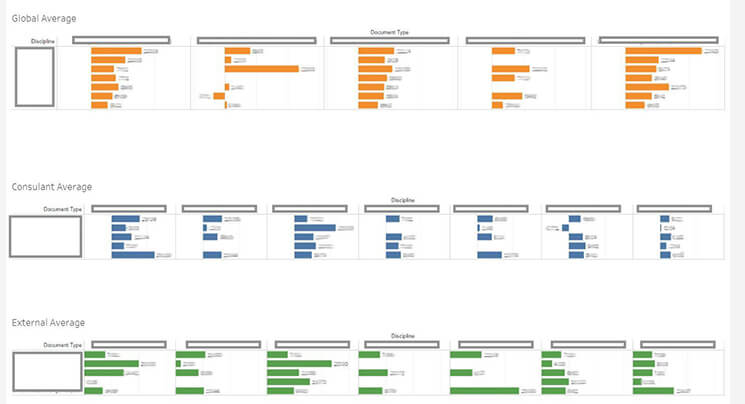
Our performance report shows a consultant scorecard, so we can see which projects the consultant has worked on and the average response time to active documents. This scorecard helps DIALOG choose consultants (e.g. electrical, structural, mechanical, etc.) that respond quickly, thus, reducing potential project delays and budget overruns. In addition, our dashboard allows DIALOG to view contractors they have worked with in previous projects and their performance (e.g. days it took to respond to documents). This also helps them see which contractors are good for specific type of projects (e.g. healthcare, commercial, public space, etc.).
Automation and Unifying Data for Construction Analytics
Onware and other construction management software (e.g. Procore) typically has siloed data for projects. In other words, to find information, you have to specify parameters, such as the company, project, and details, before the information will display. Onware Business Solutions will connect to various construction management software to get the information out of the silos and obtain an overview of all the projects and their details. Furthermore, it becomes easy to go from a high level to a more granular level of detail.
Because Principals at DIALOG are busy, they typically want to see a brief overview of their projects. If there are problems, they can locate the Contract Administrator in charge of the specific job and find resolutions for issues. Therefore, on the Tableau Server every Friday at 4:00 PM, we run some custom code that connects to Tableau’s Application Programming Interface (API). It queries the Onware database to find active projects, the Principal in Charge, and the Contract Administrator. This automated process combines four dashboards into a single page report card that is exported to PDF and emailed to the Principals and Contract Administrators.
Future Improvements
There is additional functionality that we can implement to improve data quality and process. For example, we can create data alerts to check projects that are active but do not have a studio assigned to it. Administrators can be sent automated data alerts to correct data issues in the database.
We can build many different dashboards for construction analytics. What we talked about in this case study is only the tip of the iceberg. Individual project owners typically have custom reporting requirements and formats. Tools like Tableau, along with a certified data source, turn custom report generation into an easy drag-and-drop exercise.
Questions About BI Software, Data Analytics, and Data Visualizations?
At Onware, we have over extensive knowledge and experience with construction BI, analytics, and data visualizations. With Tableau, we can help you build construction management reporting and make project management simple and easy. Whether it be with architects, construction owners, general contractors, engineers, government entities or services providers, we can design a custom-tailored solution that is built for your organization.
Call us and speak to one of our data experts and we will answer any questions you may have. Trust Onware to help you unleash your data through visual analytics; we offer “proof of concept” packages to connect your data to our set of starter dashboards.
Enjoy this post?
Visit our website for more content including additional case studies, news and events, and tips and tricks to elevate your visual analytics. Follow our social media for updates in software, BI, and data.