How we turned an office curiosity into a useful insight and how you can do the same at home or in the office!
At Onware, our team is always having fun and working hard. We believe in staying hydrated, and if needed, caffeinated.
That is why we have a coffee machine and hot water dispenser for tea. We also have a beverage fridge, fully stocked and carefully curated by our team (and yes, we have beer too!) so that anyone, including guests, can enjoy.
One day, our data enthusiast and Principal, Fraser, wanted to incorporate Tableau into a fun office project.
“It would be cool if we could create a visualization with Tableau to see our beverage consumption” – Fraser
So, he paced around the office looking for some equipment. All he needed were 4 things:
1. Google Forms – Gather Data
Beverage Consumption Questionnaire by Google Forms
Google Forms is a free application used to create surveys or questionnaires. It’s customizable, therefore, you can create great designs.
At Onware, we like clean and minimalist styles, so we only added a picture, changed the colour, and kept the survey short and concise.
Our survey asked:
- Who is drinking?
- What type of beverage are you drinking?
- What are you drinking? (Actual name of the drink)
2. Google Sheets – Store Data
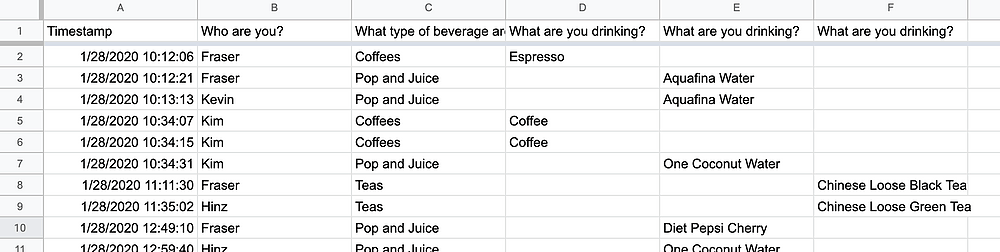
Onware’s Beverage Consumption Data on Google Sheets
Google Sheets is another free application from Google. It’s a spreadsheet program that is very similar to Microsoft Excel.
Automation tip: Google Forms automatically feeds data into Google Sheets
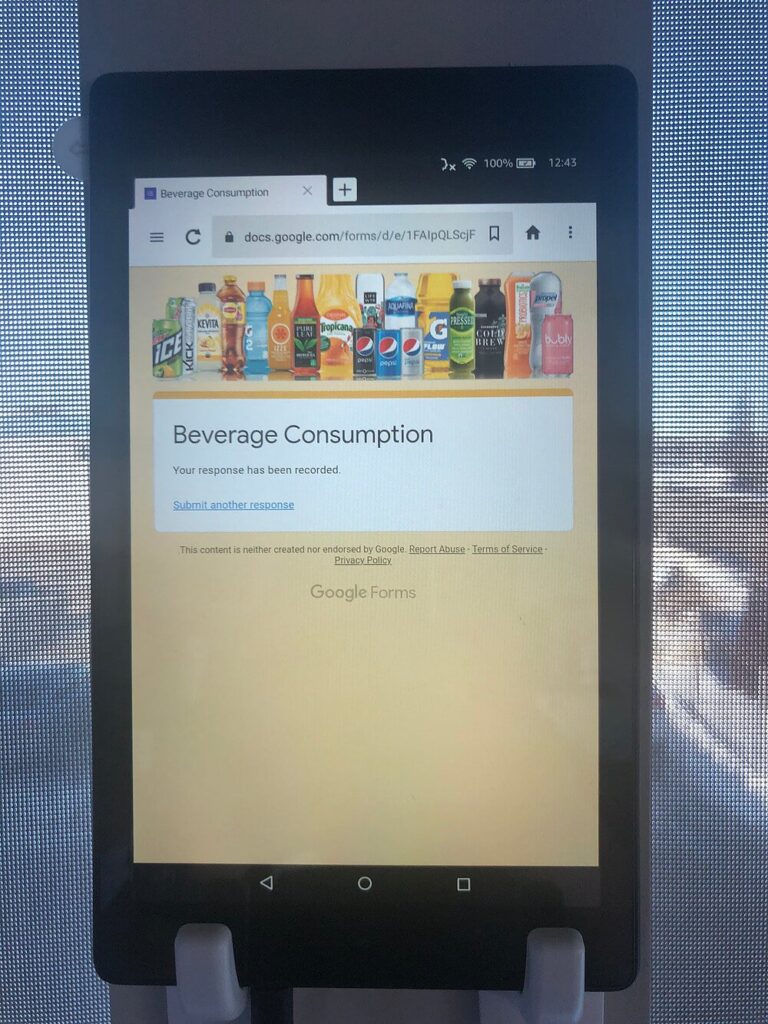
3. Mobile Device (Tablet, Phone) – Input Data

Tablet with Beverage Consumption Questionnaire
As a company that loves tech, we have many cool gadgets lying around the office. Fraser found an Amazon Fire tablet, and it works perfectly because its small enough to hang on the wall.
It’s not required to hang a tablet or buy a new one (you can use – almost – any device as long as it has an internet browser).
For us, it makes sense because we have inexpensive tablets lying around collecting dust, and seeing it helps remind us to complete the questionnaire whenever we grab a drink.
Tip: We used 3M utility hooks to hold our tablet
4. Tableau
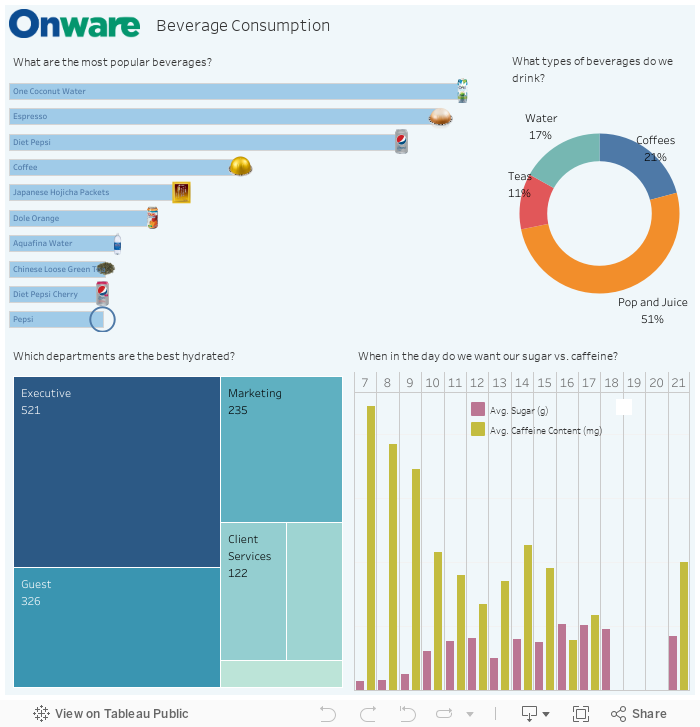
Tableau is a powerful visual analytics software. Thus, it is what we used for our interactive dashboard above.
Tableau helps us see and understand our data
We are a Tableau Partner and have been for almost 10 years. As a result, we like to think of ourselves as experts and we can do really cool things with it. But thankfully, you don’t need to be an expert to use Tableau – you can try it yourself (they have a free version). Connect your Google Sheets to Tableau, drag and drop dimensions and values, and you can create the visualization like the one we have.
Tableau’s visualizations have a live connection to Google Sheets so as new data comes in the dashboards update automatically. Furthermore, we can even set up some automated subscriptions to get a copy of the dashboard delivered to our Inbox on a weekly basis.
Take it to the Next Level
As a fun activity, we have set up a basic system to collect our data. Moreover, we can take it to the next level by implementing a barcode scanner to determine what is being consumed and use a camera and facial recognition to automatically detect who is drinking – you can almost become an Amazon Go Store.
Now that you are at the end, you may be wondering what the insight was for us? Since we noticed almost immediately that bottled water was the most consumed drink, we figured we could save money and be more environmentally friendly by buying a water filter.
Enjoy this post?
Visit our website for additional content including case studies and news and events on projects that use Onware’s Collaborative Contract Administration software. Follow our social media (LinkedIn, Twitter, Facebook) for updates about software and technology in construction.
If you have any tips or ideas of your own, we would love to hear from you. Please leave a comment and share our post! Share and tag us on social media – twitter (@onwarebiz) or on LinkedIn and we will enter your name to win with one of the water bottles picture above.