Do you Excel?
Did you know one of the most popular computer applications by businesses is Microsoft’s Excel? In a 2018 survey by FSN, a U.K-based news and research organization, 71% of organizations depend on spreadsheets to collect data across business units.
Whether you are in retail, engineering, government, construction, or manufacturing, you have probably used Excel for data collection and analysis. I have seen Excel used in various ways including payroll and accounts receivable; budget and cost tracking; project management; income statements and balance sheets for financial reporting; and other reporting dashboards.
Typically, Excel is the spreadsheet tool of choice because people are familiar with using it. While Excel can help with preliminary data analysis, at Onware, we believe there are better tools and platforms for collaborating and sharing data analytics.
With businesses collecting increasing amounts of data, there is a large demand for data analytics. Organizations are interested in unlocking their data’s potential and turning it into actionable insights for finding competitive advantages and optimizing their business. Consequently, leading organizations are accelerating the modernization of their analytics capabilities with alternatives to Excel.
As a result of the high demand for data analytics, the marketplace is full of business intelligence (BI) tools and platforms that offer powerful interactive self-service analytics that can perform real-time data analysis. The two industry leaders for BI and data analytics platforms are products from Microsoft and Tableau.
But first, what is Excel?
Originally released 34 years ago, Microsoft Excel is one of the most widely used spreadsheet applications in the world. Excel is part of Microsoft Office and features calculations, graphing tools, pivot tables, and a macro programming language called Visual Basics for Applications (VBA).
It is is likely the first tool many will choose for starting financial, mathematical, and statistical analysis in many different settings – personal, commercial, and educational.
What is Tableau?
Tableau is a leading self-service visual analytics platform that helps people and organizations see and understand their data. As a trusted leader in data visualization, Tableau brings together an integrated platform, a strong community, and a tool that is easy to use to help you and your organization become more data-driven.
What is Power BI?
Similarly, Microsoft Power BI is a self-service analytics and business intelligence (BI) platform that connects and visualizes any data using a unified, scalable platform. The original Power BI was based on Excel’s add-ins – Power Query, Power Pivot and Power View.
Using Excel as a Spreadsheet to Store and Collect Data
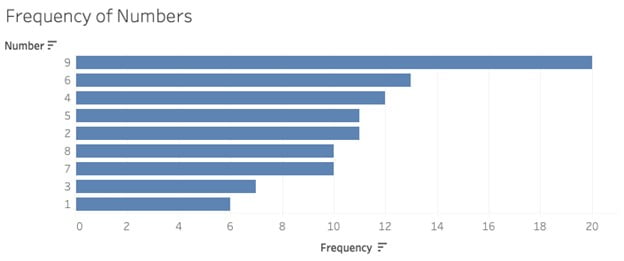
Excel can collect and store detailed data; however, having to ingest hundreds of rows of data in multiple workbooks and worksheets can be overwhelming and time-consuming. To illustrate, look at the example below. How often does the number “9” appear? How about 6? As you can see, it becomes difficult to see patterns and trends within rows of data.

Visualize your data
Now let’s visualize this data using a data visualization tool, like Tableau, to see how often each number appears.

With Tableau and Power BI, you can quickly visualize your data to recognize trends or patterns. In addition, you can easily consolidate and analyze large amounts of data – including the ones not stored in Excel.
Perform Richer Analytics with Tableau and Power BI
As a preliminary analytical tool, Excel has many built-in functions that help with data analysis. Moreover, Excel can pivot your data and create tables and charts that visually represent analytics.
However, follow-up questions about the analysis can really show limitations of Excel. For example, it may require you to know the answers to your questions before deciding how to visualize your results.
If data changes or provides unexpected results, then you may need to start your analysis from scratch or think of alternative ways to visualize and analyze data. Furthermore, Excel may require you to be an “Excel Wiz” to perform data analytics. This reduces access to only those who are expertly trained to use Excel or have a strong understanding of the data they are working with.
On the other hand, Tableau and Power BI moves past static charts and makes visual analytics interactive and flexible. Tableau and Power BI provide a more holistic view of your data without the need to master its finer details. In addition, these BI tools are easy-to-use and have intuitive drag-and-drop mechanics. This allows people of all skill levels to explore data, find answers, or ask more questions from their analyses.
Power BI and Tableau have many out-of-the-box features that allows users of all skills levels to structure, format, and display data that is easy to understand for anyone. Both platforms enable self-service data exploration to quickly identify outliers, uncover hidden patterns or trends, show geographical locations, and run predictive models into the future, so you can forecast results.
Sharing and Collaboration
When you share your data analytics in Excel, you either must share it through a printed report or PDF. Anyone who requires additional analysis or follow-up questions may need you to go back into your spreadsheet.
Collaboration within spreadsheets typically requires others to have a deep understanding of the data and how the spreadsheet works, or additional configurations like locking cells or worksheets to prevent changes to data or breaking of formulas.
Collaboration is a focal point for these data analytics and BI platforms. Power BI and Tableau allow you to easily share your analysis in a central location – like in the cloud or on a server. In addition, users can interact with data without having to understand the data’s finer details. Data can be shared in an easily consumable interactive self-service reports or dashboards.
Furthermore, Tableau and Power BI never writes back to your original data source. Therefore, you never have to worry about someone breaking formulas or corrupting data. Gone are the hours debugging your spreadsheet to figure out what was changed in your spreadsheet.
Conclusion
Modernize your reporting and analytics by removing the limitations of static reporting through spreadsheets and charts. Tableau and Power BI helps empower your users to become more data literate and explore data from a variety of different angles.
Excel can be a nice place to collect and store data; however, without the proper data governance, it is also easy to manipulate or change data. Oftentimes, reporting and analytics are based off Excel spreadsheets that are distributed across the organization and manipulated within each business units. As a result, reported figures rarely match across the organization, and it can be time-consuming for accounting or executive teams to figure out what is going on.
Power BI and Tableau builds upon a single source of truth; therefore, everyone in the organization uses the same data for analytics and consistent reporting.
If you have questions about Excel spreadsheets or any other data reporting and analytics, contact Onware Business Solutions. We understand your Excel spreadsheets are customized for your needs. Thus, we will help your organization move past your reliance on reporting inside of Microsoft Excel with fully customized BI reports and dashboards using Tableau or Power BI. Let us help you and your organization transform your data into actionable insights.
Enjoy this post?
Visit our website for more content including additional case studies, news and events, and tips and tricks to elevate your visual analytics. Follow our social media (LinkedIn and Twitter) for updates in software, BI, and data.


